
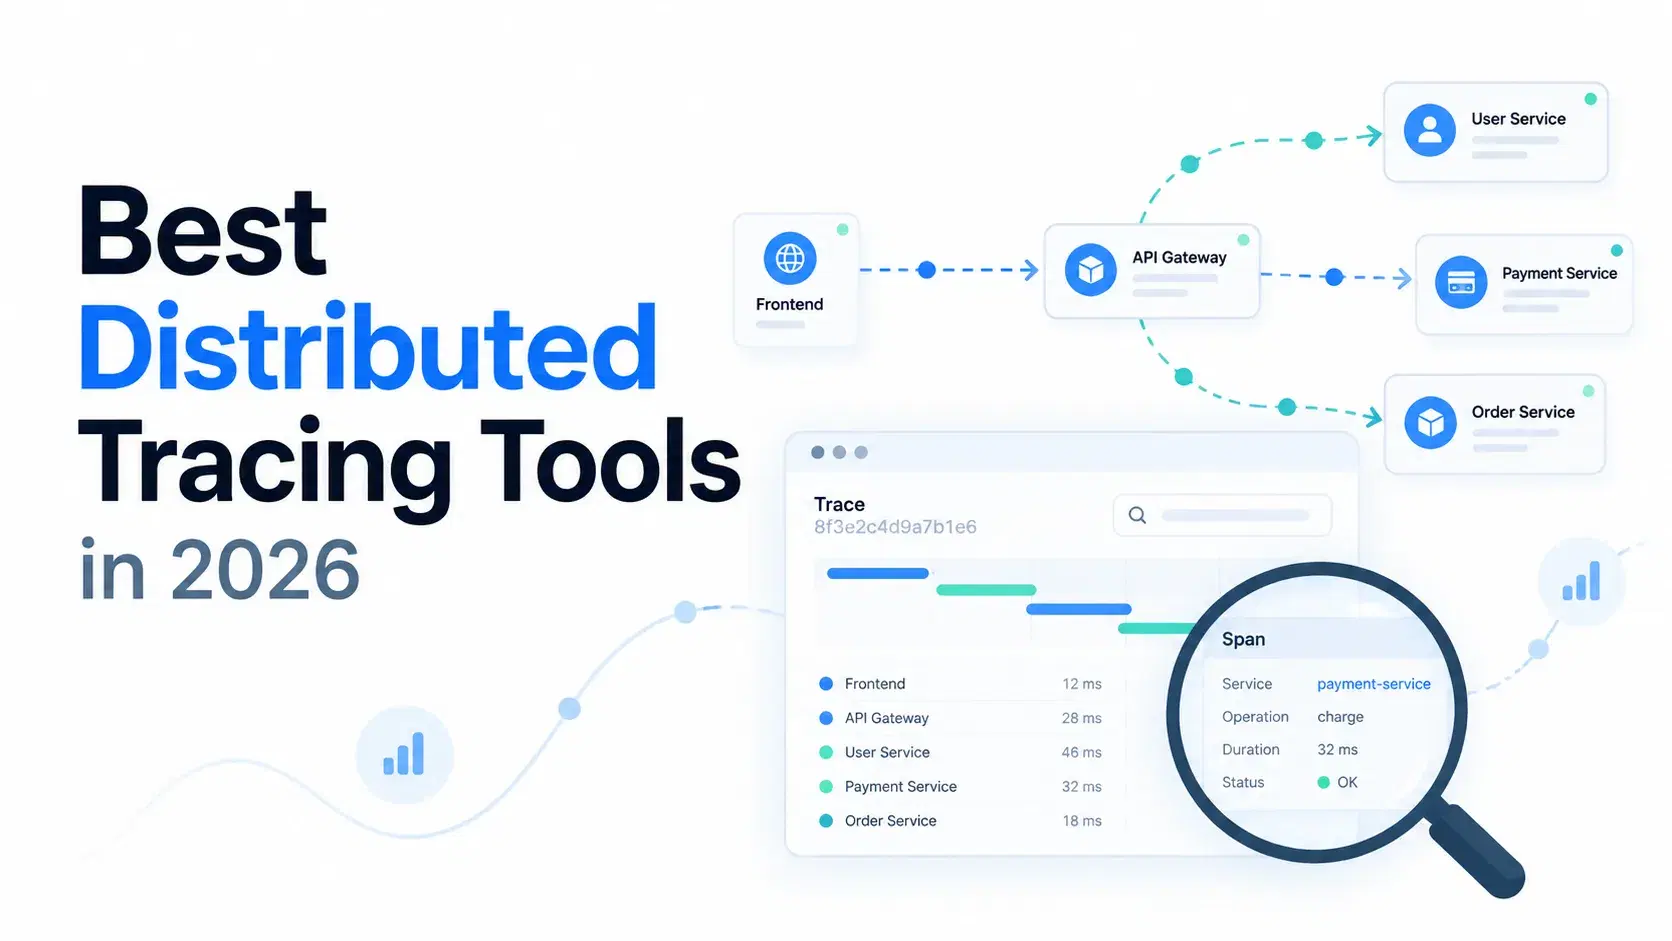
A single checkout request in a microservice app can touch a load balancer, three services, a Postgres cluster, a queue and Stripe, and when it takes four seconds the logs from each hop do not line up on their own. Distributed tracing stitches those hops into one timeline, and the bill for storing that timeline is where most teams get surprised.
The pricing models no longer measure the same thing. As of September 25, 2026, Grafana Cloud and SigNoz charge per gigabyte of spans, Honeycomb and Dash0 per span, Datadog per host plus per million indexed spans, and AWS per trace or per gigabyte depending on the product. You cannot compare them without knowing how big your spans are, so we measured one.
What Do Teams Actually Run for Tracing?
OpenTelemetry is now the default way to produce traces, though most teams are mid-adoption. In Grafana Labs' fourth annual Observability Survey, published March 18, 2026 from 1,363 responses collected between October 1, 2025 and January 6, 2026, 76% of respondents reported investing in OpenTelemetry, 41% used it in production, and 50% used it for traces. Grafana Labs sells one of the products below, so treat it as a large community sample, not a neutral census.
The rest of the market is moving the same way. Jaeger v1 reached end of life on December 31, 2025, after its final release, v1.76.0, on December 3, 2025. AWS put the X-Ray SDKs and daemon into maintenance mode on February 25, 2026, limited to security fixes, and recommends OpenTelemetry instead. Instrumentation is settled; the backend is now a storage and query decision you can revisit.
What Does a Month of Traces Cost on Each Backend?
It depends on bytes per span, so we measured that first. With the official OpenTelemetry JavaScript SDK (@opentelemetry/sdk-trace-base 2.11.0) and its OTLP serializer (@opentelemetry/otlp-transformer 0.222.0), we generated 50,000 spans from a checkout request: an HTTP server span, three SQL queries, calls to an inventory service and Stripe, a queue publish and four internal spans, with us-east-1 Kubernetes resource attributes. In the SDK's default batches of 512, a span averaged 266 bytes as OTLP protobuf and 656 bytes as OTLP JSON.
Treat 266 bytes as a lean baseline: auto-instrumentation adds attributes, and none of the per-GB pricing pages say whether a gigabyte is measured before or after compression. The script prices two sampled workloads at list price and takes span size as an argument.
js// trace-cost.mjs - monthly cost of storing the same sampled trace volume. // Rates are list prices from each vendor's pricing page, checked 2026-09-25. const BYTES_PER_SPAN = Number(process.argv[2] ?? 266) // measured OTLP protobuf size const workloads = [ { name: "50M spans/mo, 6 hosts", spans: 50e6, hosts: 6 }, { name: "500M spans/mo, 24 hosts", spans: 500e6, hosts: 24 }, ] const SPANS_PER_TRACE = 10 // Tiered per-GB rate: tiers are [upToGB, pricePerGB] function tiered(gb, tiers) { let cost = 0, prev = 0 for (const [upTo, price] of tiers) { const inTier = Math.max(0, Math.min(gb, upTo) - prev) cost += inTier * price prev = upTo } return cost } const backends = { "Grafana Cloud Traces": ({ gb }) => { const billable = Math.max(0, gb - 50) // 50 GB included with the $19 platform fee return 19 + tiered(billable, [[10000, 0.05], [25000, 0.046], [Infinity, 0.044]]) // process + tiered(billable, [[1000, 0.40], [2500, 0.37], [Infinity, 0.355]]) // write, 30-day retention }, "SigNoz Cloud": ({ gb }) => Math.max(49, gb * 0.30), // $49 minimum includes $49 of usage "Datadog APM": ({ spans, gb, hosts }) => { const hostFees = hosts * (31 + 15) // APM + required Infrastructure Pro, billed annually const ingest = Math.max(0, gb - hosts * 150) * 0.10 const indexed = Math.max(0, spans - hosts * 1e6) / 1e6 * 1.70 // 15-day retention return hostFees + ingest + indexed }, "Honeycomb Pro": ({ spans }) => (spans <= 50e6 ? 150 : null), // only the 50M tier is published Dash0: ({ spans }) => (spans / 1e6) * (0.06 + 0.54), // ingest + store, 30-day retention "AWS X-Ray (classic)": ({ spans }) => Math.max(0, spans / SPANS_PER_TRACE - 1e5) / 1e6 * 5.0, "CloudWatch Transaction Search": ({ gb }) => tiered(gb, [[10000, 0.35], [30000, 0.20], [Infinity, 0.15]]), "Self-hosted Tempo (S3 only)": ({ gb }) => gb * 0.023, // storage for 30 days; compute not included } console.log(`bytes per span: ${BYTES_PER_SPAN}`) for (const w of workloads) { const gb = (w.spans * BYTES_PER_SPAN) / 1e9 console.log(`\n${w.name} = ${gb.toFixed(1)} GB`) for (const [name, price] of Object.entries(backends)) { const cost = price({ ...w, gb }) console.log(` ${name.padEnd(31)} ${cost === null ? "not published" : "$" + cost.toFixed(2)}`) } }
Running node trace-cost.mjs prints:
textbytes per span: 266 50M spans/mo, 6 hosts = 13.3 GB Grafana Cloud Traces $19.00 SigNoz Cloud $49.00 Datadog APM $350.80 Honeycomb Pro $150.00 Dash0 $30.00 AWS X-Ray (classic) $24.50 CloudWatch Transaction Search $4.66 Self-hosted Tempo (S3 only) $0.31 500M spans/mo, 24 hosts = 133.0 GB Grafana Cloud Traces $56.35 SigNoz Cloud $49.00 Datadog APM $1913.20 Honeycomb Pro not published Dash0 $300.00 AWS X-Ray (classic) $249.50 CloudWatch Transaction Search $46.55 Self-hosted Tempo (S3 only) $3.06
Rerun it with node trace-cost.mjs 1000 for 1 KB spans and only the per-GB backends move: at 500 million spans, Grafana Cloud rises to $221.50, SigNoz to $150.00 and CloudWatch Transaction Search to $175.00, while Datadog, Dash0 and X-Ray do not change. Small spans favor per-GB pricing; fat spans make per-span pricing competitive. The model assumes you sample at the source and omits self-hosting compute, extended retention and volume discounts.
Jaeger
Jaeger is the CNCF-graduated open source tracing platform, and v2 changed its foundation: the docs state that "the Jaeger binary is built on top of the OpenTelemetry Collector framework".
Its strength is choice of storage: Elasticsearch, OpenSearch, Cassandra, Badger or ClickHouse, which v2.21.0 promoted to stable on September 14, 2026. That release also removed legacy v1 HTTP endpoints, so check anything scripted against the old query API.
What Jaeger does not do is run itself. The project offers no hosted service, so you operate the storage cluster, and that cluster is where the real cost lives. License: Apache 2.0 · Version: v2.21.0 · Stars: 23.2k, as of September 25, 2026.
Grafana Tempo and Grafana Cloud Traces
Grafana Tempo is built for cheap storage, requiring "only object storage to operate" in Grafana's words. It ingests OpenTelemetry, Jaeger and Zipkin data and is queried with TraceQL.
Tempo 3.0, released May 28, 2026, replaced the legacy ingesters with a new write architecture, made TraceQL metrics generally available and removed OpenCensus support. Object storage is the win: our 133 GB month is $3.06 in S3 Standard in us-east-1 at $0.023 per GB-month, before compute.
The tradeoff is that Grafana is the UI (Tempo's README sends UI issues to the Grafana repo), and 3.0's distributed write path brings Kafka into the deployment, which single-binary mode can skip. Grafana Cloud Traces pricing: Free with 50 GB and 14-day retention · Pro $19/month platform fee including 50 GB, then $0.05/GB processed plus $0.40/GB written, 30-day retention. License: AGPL-3.0 · Version: v3.0.3.
SigNoz
SigNoz is an open source, OpenTelemetry-based APM that stores traces, logs and metrics in ClickHouse, which its docs place "at the core of SigNoz's data storage".
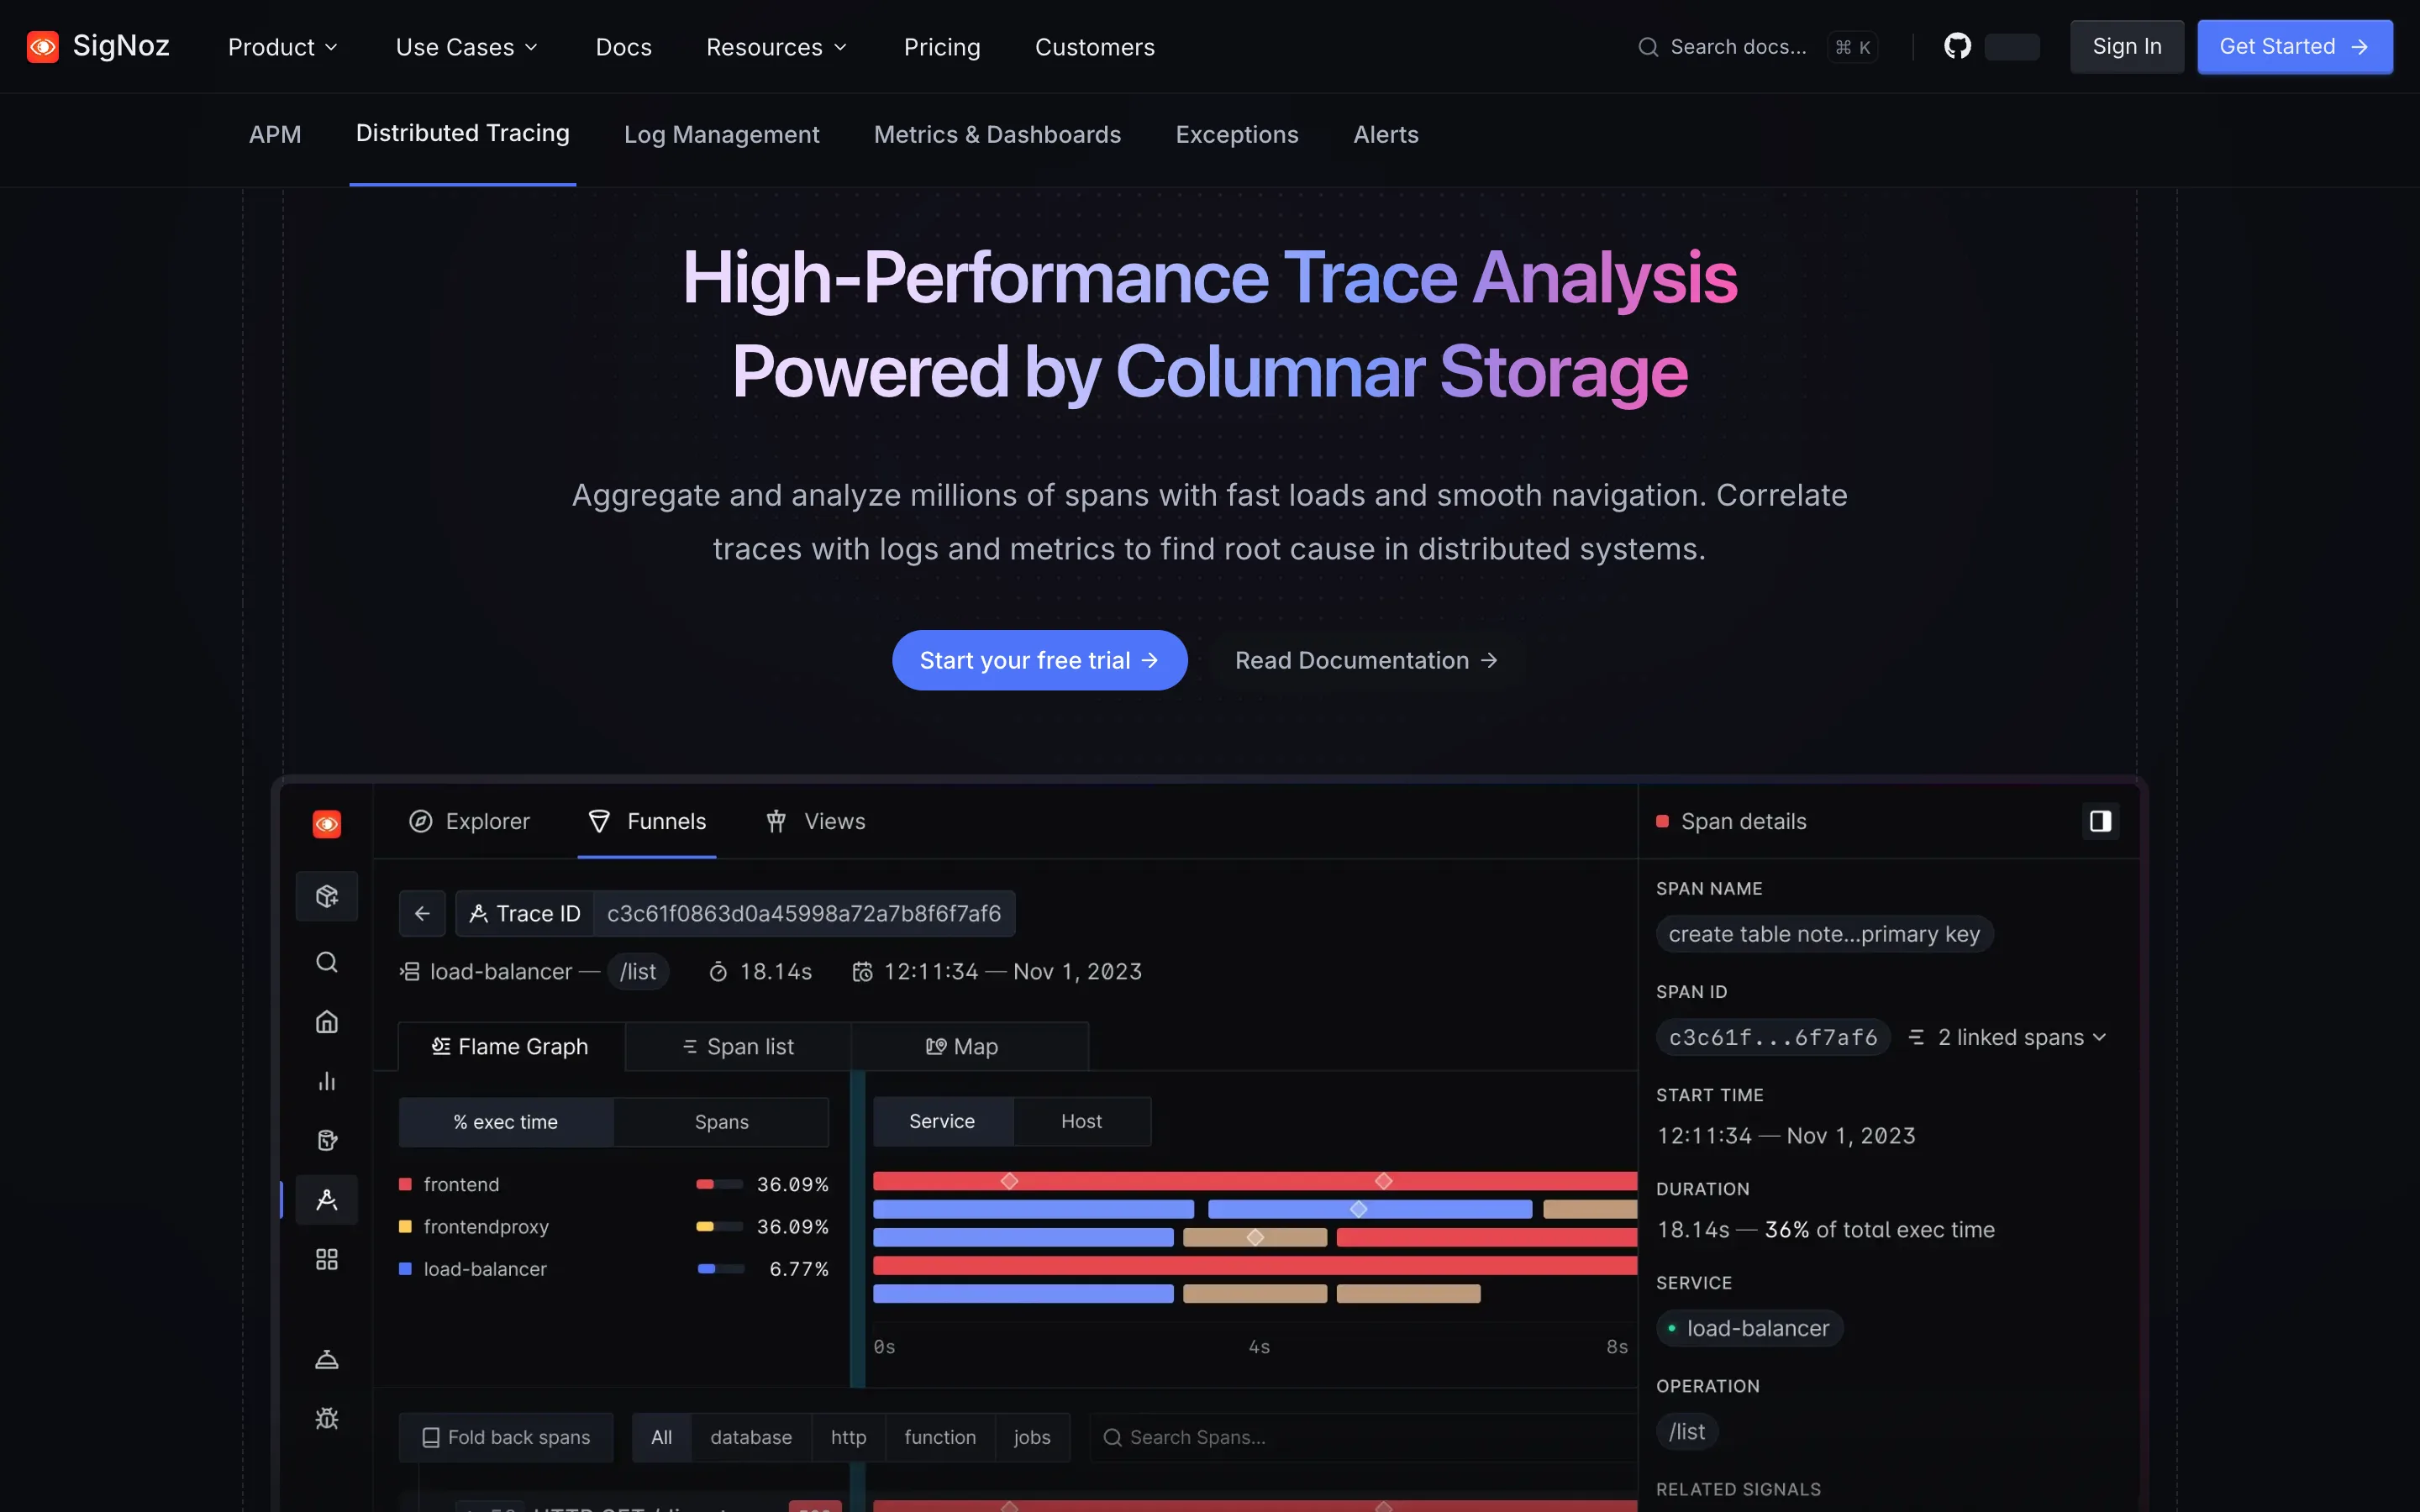
It puts traces, logs and metrics in one UI with no host or user pricing, offers a self-hosted edition, and has the simplest cloud price here: $0.30 per GB of traces with 15-day retention.
What it does not give you is a pure MIT stack: the license file puts the ee/ directory under a separate enterprise license, and running ClickHouse at volume is real operations work. Pricing: $49/month minimum including $49 of usage, then $0.30/GB. License: MIT, except ee/ · Version: v0.143.0 · Stars: 32.2k.
Honeycomb
Honeycomb stores traces as events and prices by event count: every span is one event, and each OpenTelemetry span event and link counts as another.
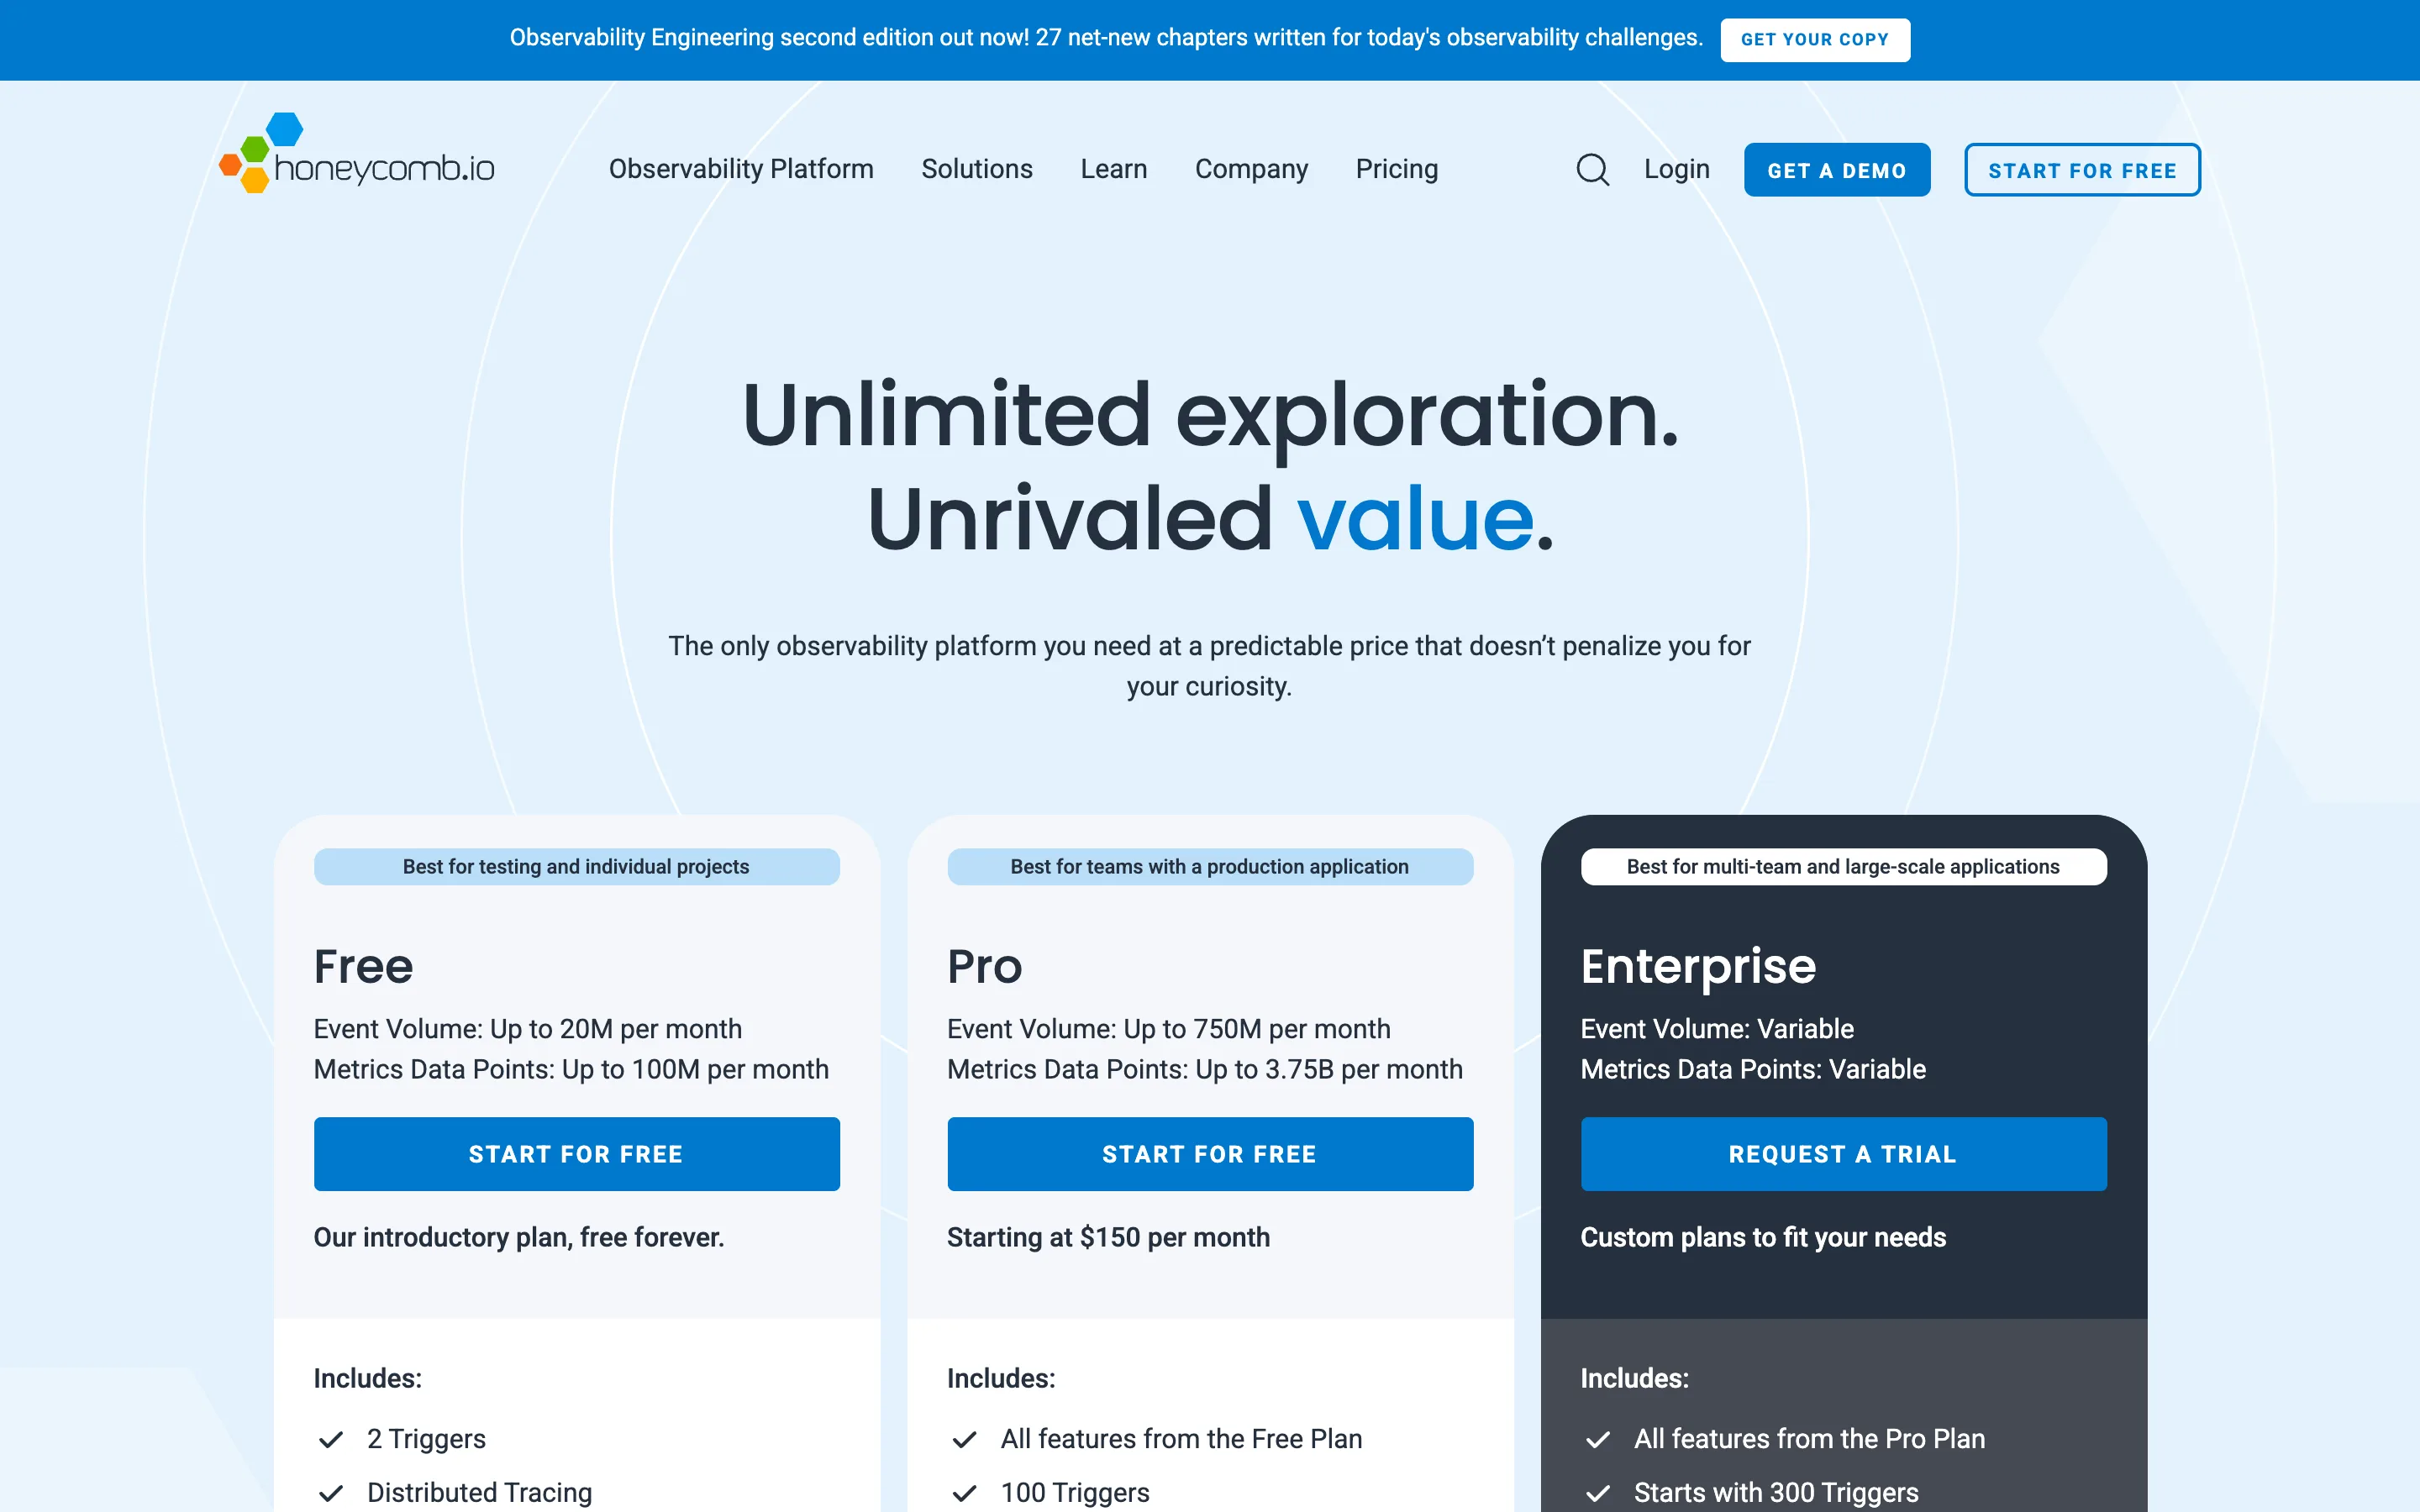
Its strength is that attributes are free: the pricing page advertises "unlimited custom fields", so a customer ID or feature flag on every span costs nothing extra. Retention is 60 days, the longest default among the hosted options here.
The catch is predictability. Honeycomb publishes only the $150 per 50 million events entry point, so at 500 million spans you are talking to sales, and two consecutive months over your limit lead to throttling after a 10-day warning. Pricing: Free up to 20M events · Pro from $150/month for 50M events, up to 750M · Enterprise custom.
Datadog APM
Datadog APM makes most sense when Datadog already monitors your infrastructure, because a trace correlates with the metrics, logs and processes behind it.
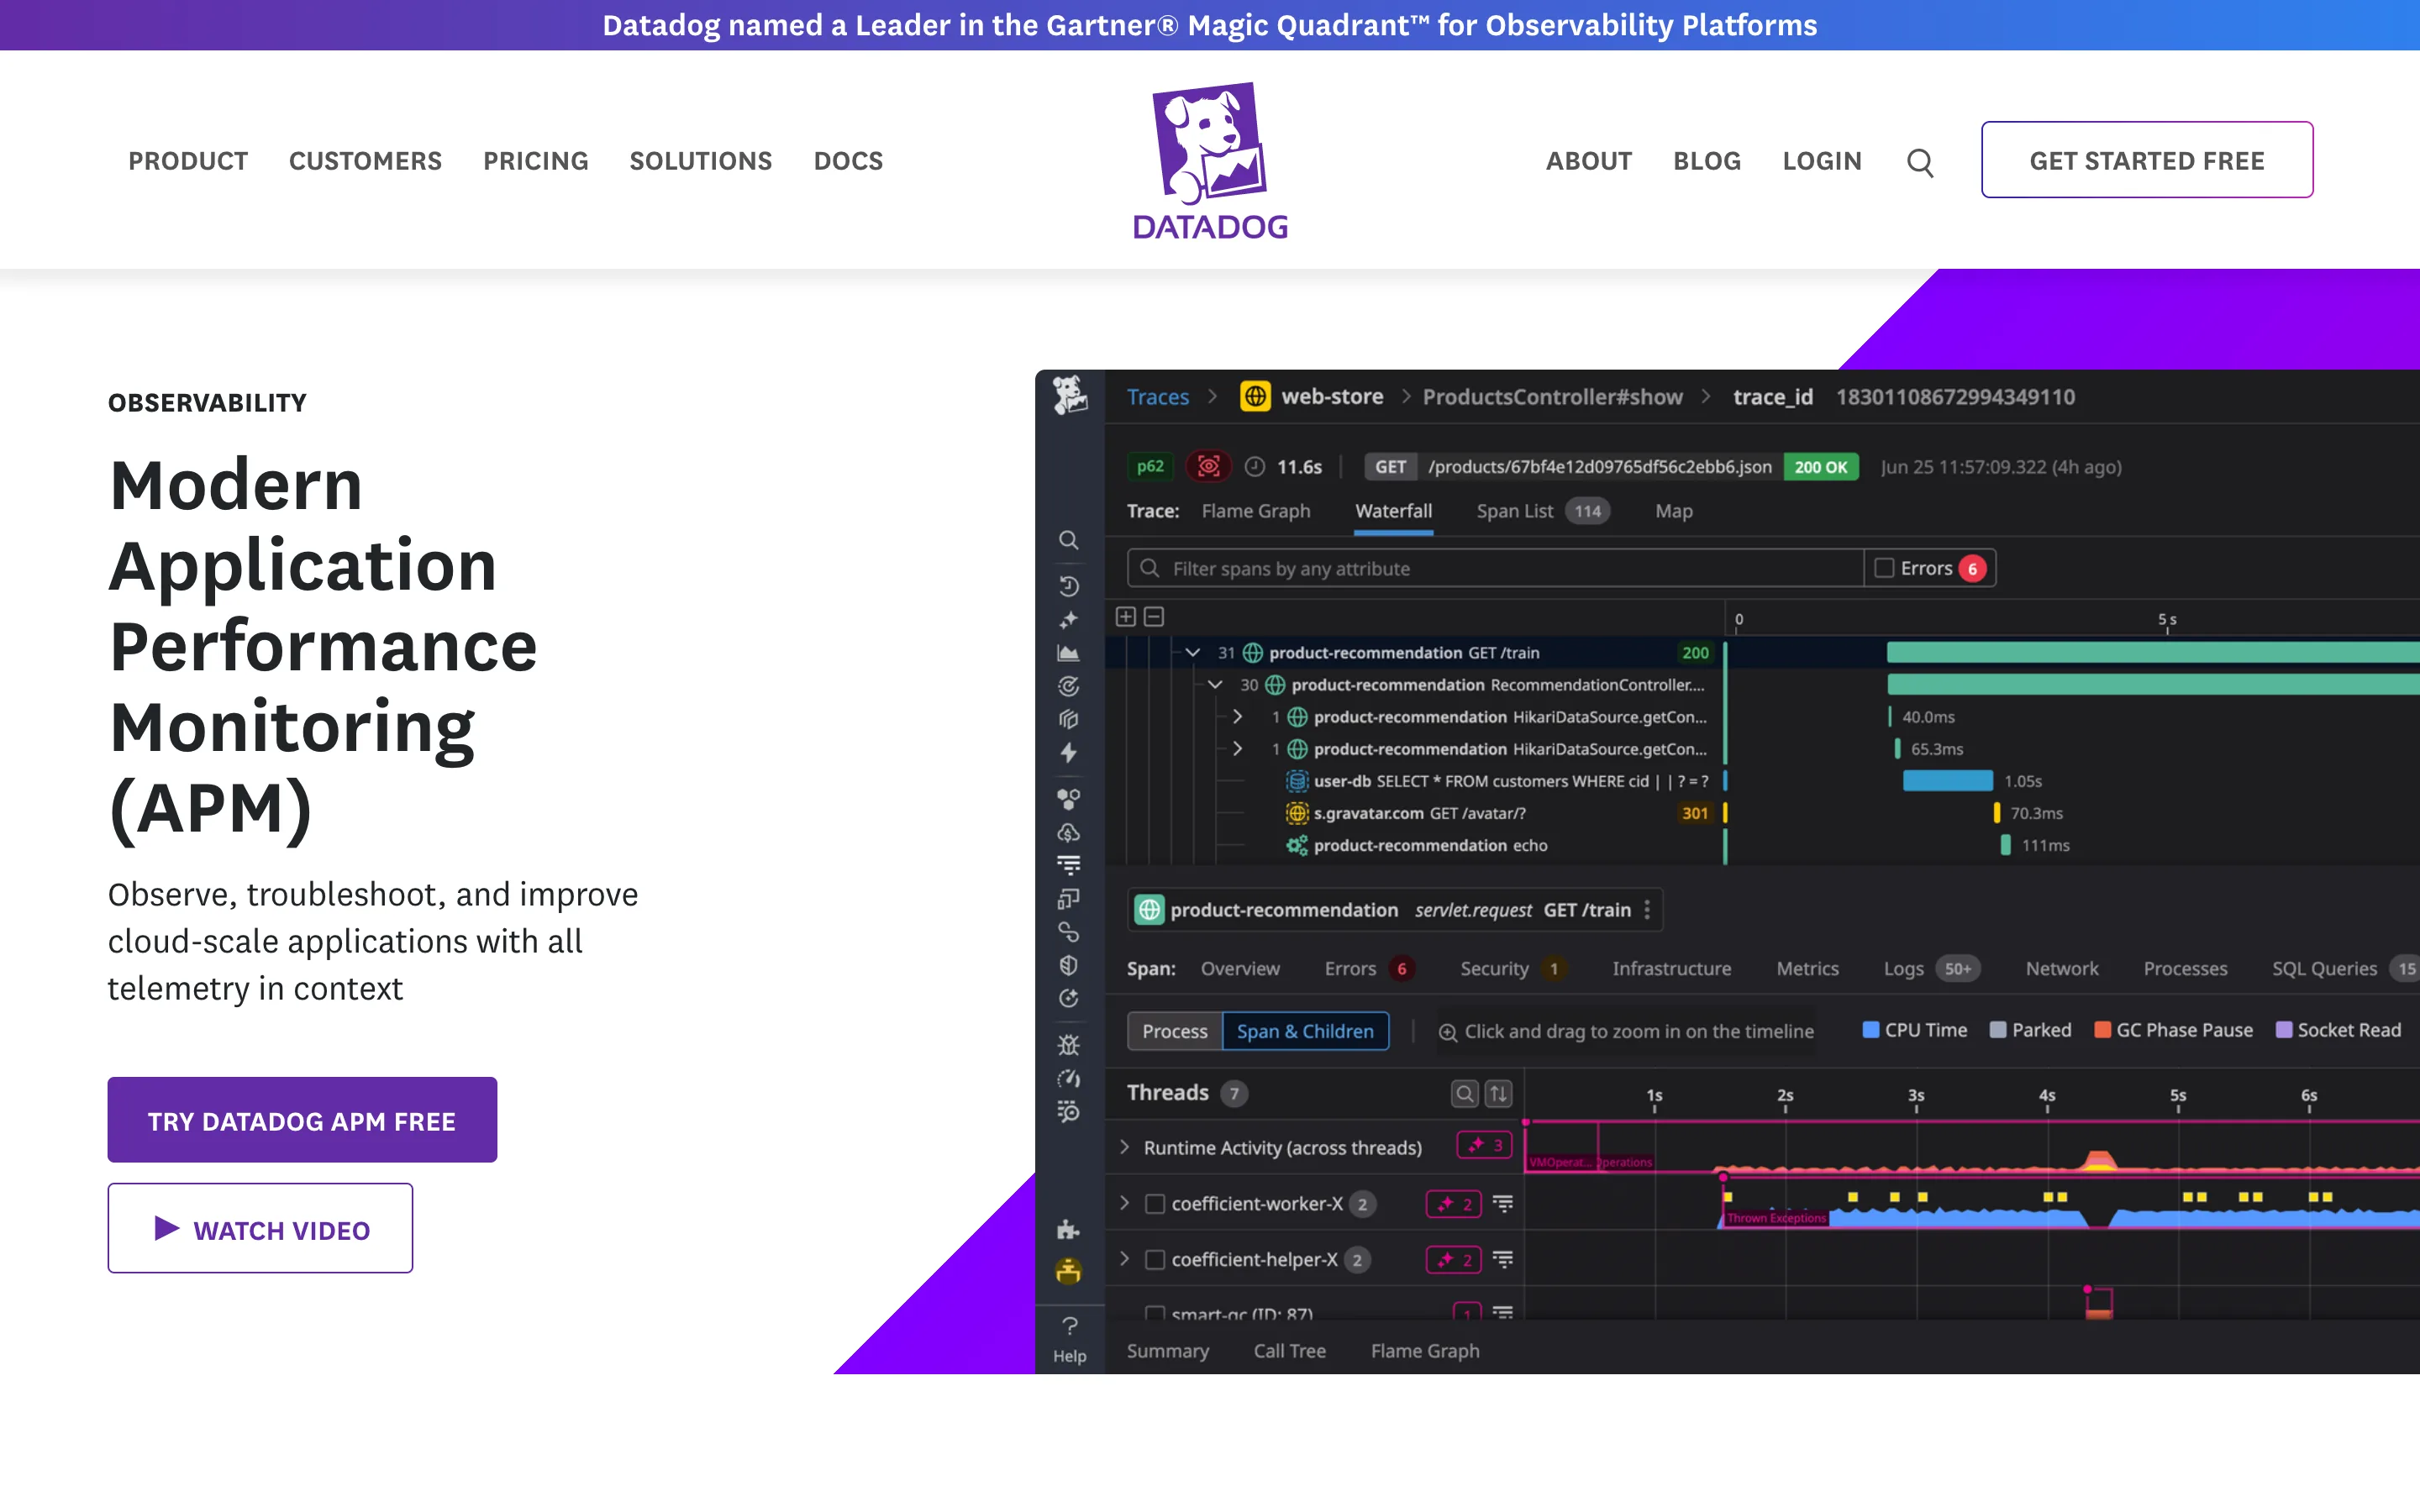
It prices by host. APM lists at $31 per host per month billed annually ($48 on demand), assuming Infrastructure Monitoring at $15 per host. Each APM host includes 150 GB of ingested spans and 1 million indexed spans a month, then $0.10 per GB and $1.70 per million indexed spans with 15-day retention.
What it does not do is get cheaper when spans do: in our model, hosts plus indexing were the entire Datadog total at both span sizes. Pricing: APM $31, APM Pro $35, APM Enterprise $40 per host per month, billed annually.
Dash0
Dash0 describes itself as "OpenTelemetry-native" and prices by signal count rather than by host or gigabyte, with separate rates for ingesting a span and for keeping it.
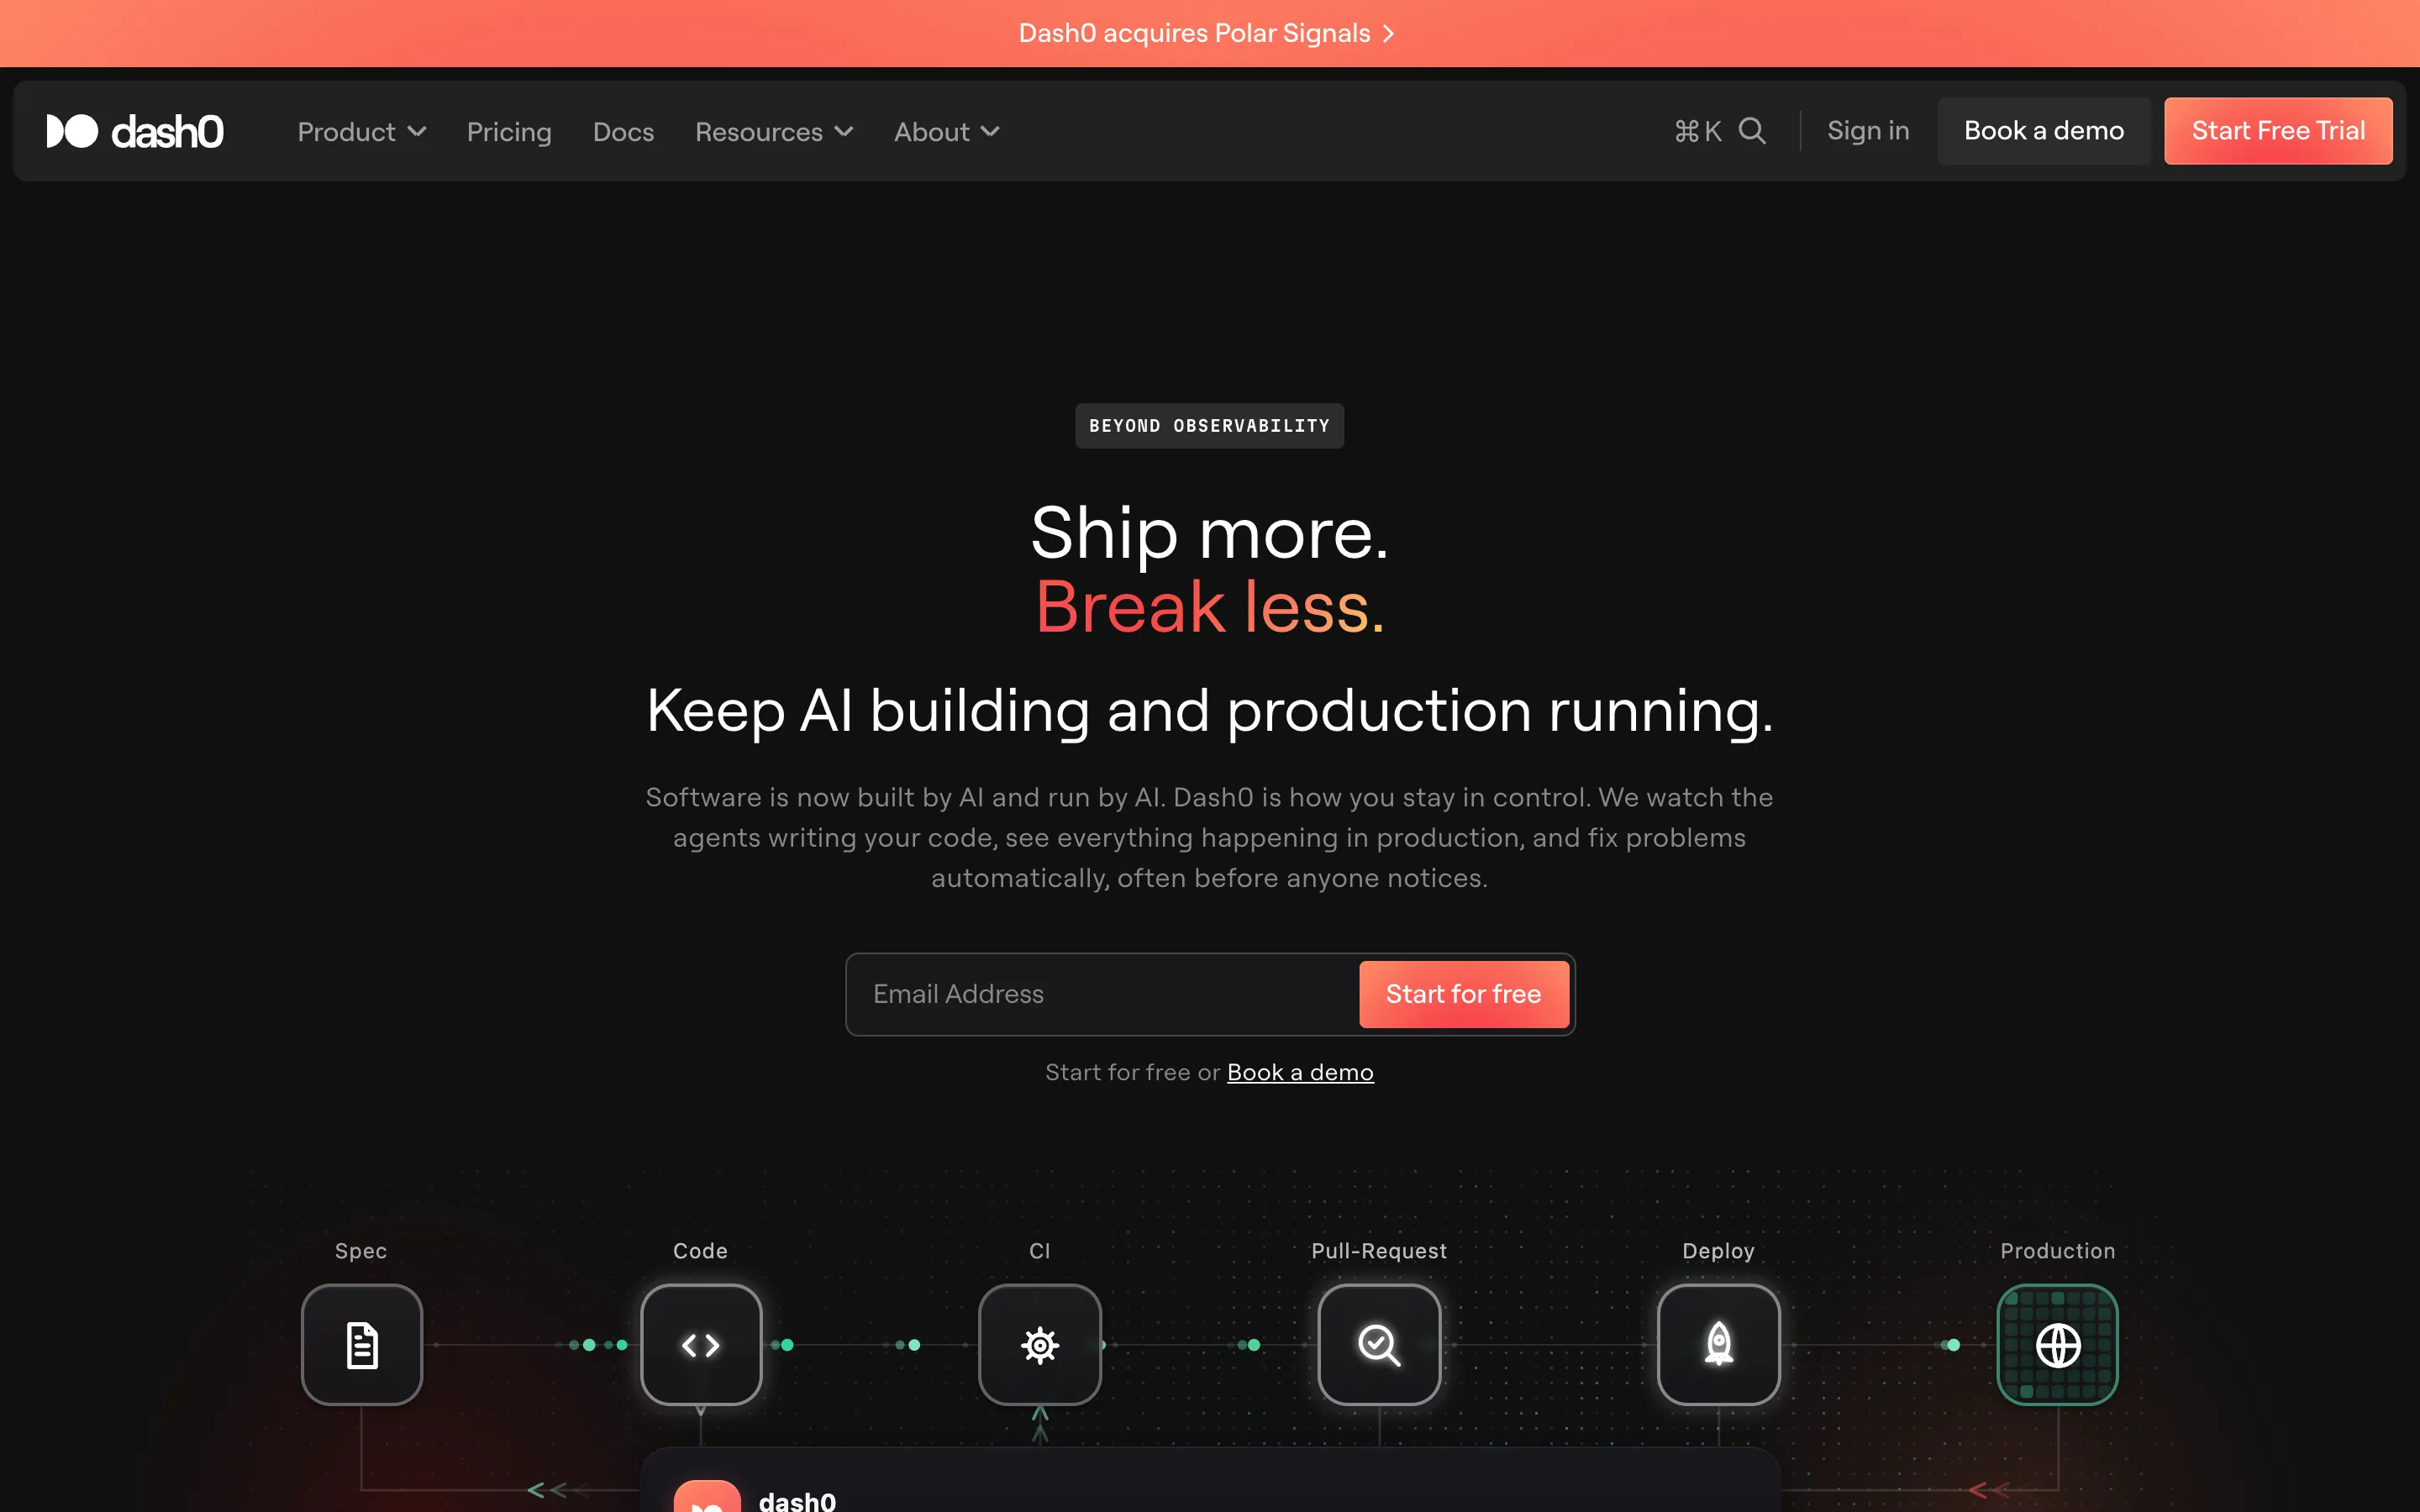
The price is $0.060 per million spans ingested plus $0.540 per million stored, with 30-day retention, and spans dropped by its SignalControl filtering pay only the ingestion rate, so sampling inside the product is cheap.
It has no free tier, only a 14-day trial, and per-span pricing means lean spans get no discount: at 1 KB and 500 million spans, Grafana Cloud ($221.50) and SigNoz ($150.00) still undercut its $300.00. Pricing: $0.60 per million spans ingested and kept for 30 days, with tiered discounts for very high volume.
AWS X-Ray and CloudWatch Transaction Search
AWS X-Ray is being folded into CloudWatch: as of September 25, 2026 the X-Ray product URL redirects to CloudWatch's Application Observability page, and CloudWatch Transaction Search now prices spans by the gigabyte alongside the classic per-trace X-Ray rate.
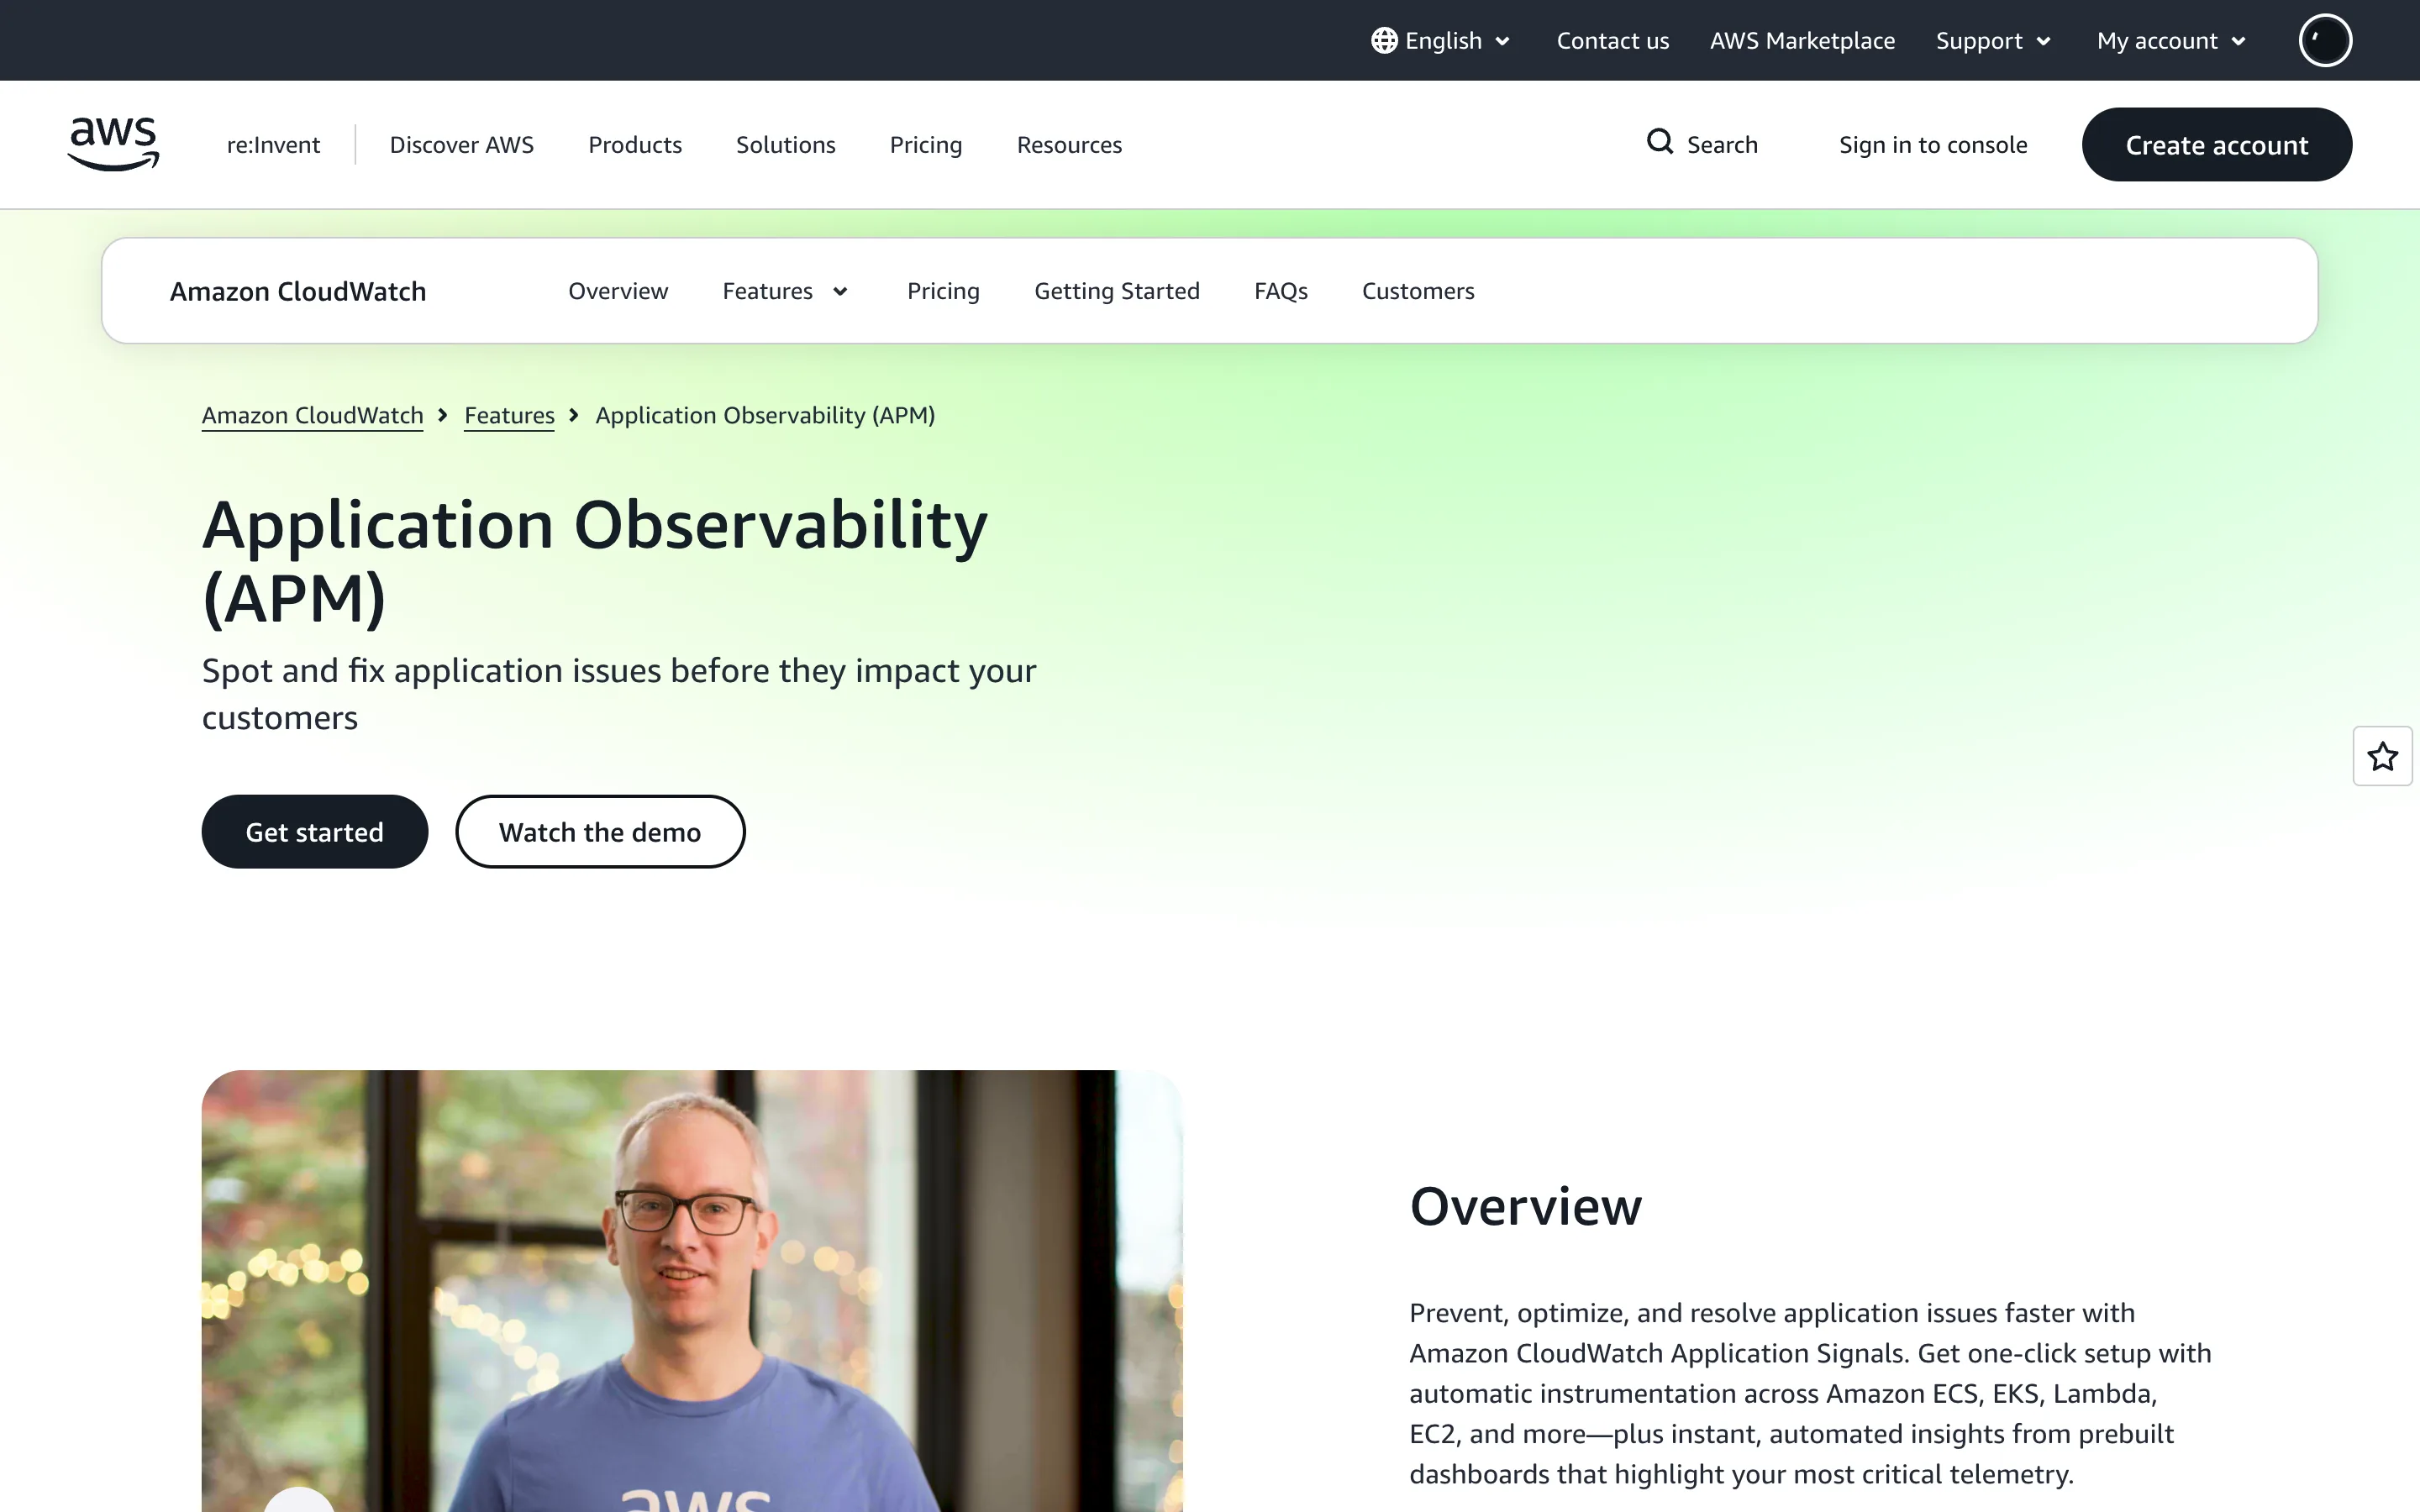
For teams on AWS it needs no new vendor. Classic X-Ray bills $5.00 per million traces recorded and $0.50 per million retrieved or scanned in us-east-1, with 100,000 traces recorded free each month. Transaction Search bills $0.35 per GB for the first 10 TB ingested plus $0.75 per million spans indexed beyond the free 1%, which AWS calls a "simplified bundled price".
The limit is that it is an AWS product: classic X-Ray keeps trace data for 30 days, the SDKs are in maintenance mode, and moving off later means leaving the CloudWatch console your team learned. Pricing: usage only, no platform fee.
Side by Side
| Backend | Billing unit | Entry price | Default retention | License |
|---|---|---|---|---|
| Jaeger | Your storage | $0 | You decide | Apache 2.0 |
| Grafana Tempo | Per GB (Cloud) | Free 50 GB, Pro $19/mo | 30 days (Pro) | AGPL-3.0 |
| SigNoz | Per GB | $49/mo minimum | 15 days | MIT + ee/ |
| Honeycomb | Per event | Free 20M, Pro $150/mo | 60 days | Proprietary |
| Datadog APM | Per host + indexed span | $31/host/mo | 15 days | Proprietary |
| Dash0 | Per span | $0.60 per 1M kept | 30 days | Proprietary |
| AWS X-Ray | Per trace or per GB | 100k traces free | 30 days (classic) | Proprietary |
How to Choose Without Migrating Twice
- Instrument with OpenTelemetry first. Jaeger v2 is built on the OpenTelemetry Collector and AWS recommends OpenTelemetry over its own SDKs, so vendor-specific instrumentation is what forces a second migration.
- Measure your real span size. Point a Collector at a file exporter for an hour of production traffic and divide bytes by spans. That number decides whether per-GB or per-span pricing is cheaper.
- Decide where sampling happens. Tail sampling in your own Collector lowers every bill above; sampling inside the vendor still charges ingestion on Grafana Cloud and Dash0.
- Price your own month. Put your span count, span size and host count into the script above, with the retention you need.
- Keep a Collector between apps and vendor. It lets you dual-write to a second backend for a trial month and switch with a config change.
Which One Should You Actually Use?
Small team, tight budget: Grafana Cloud Traces. Its Pro plan includes 50 GB a month for the $19 platform fee, which covered our entire 50-million-span workload.
You want to own the data: Tempo if you already run Grafana, Jaeger with ClickHouse for a standalone UI. Budget for operations time, not storage.
Already paying Datadog for infrastructure: stay, but index deliberately. At 24 hosts, indexed spans were $809.20 of our $1,913.20 month, and retention filters control that line.
Everything runs on AWS: CloudWatch Transaction Search, the cheapest hosted option in both of our workloads ($4.66 and $46.55).
Debugging high-cardinality production behavior: Honeycomb, where free-form attributes and 60-day retention are the product rather than an add-on.
Conclusion
OpenTelemetry won the instrumentation fight. What changed in 2026 is that backends split into per-host, per-GB and per-span pricing, which diverge roughly 40 times on the same workload: $1,913.20 on Datadog against $46.55 on CloudWatch Transaction Search for 500 million spans in our model. Before renewing a tracing contract, ask how many bytes your average span is. It takes an hour to measure and decides the answer.
Related DevToolLab Tools
- OTel Config Generator - build the Collector YAML that tail-samples and dual-writes to a trial backend.
- Protobuf Decoder - OTLP is Protocol Buffers, so this reads a captured span payload without a
.protofile. - gRPC Status Code Lookup - explain the
UNAVAILABLEandRESOURCE_EXHAUSTEDerrors an OTLP exporter logs when a backend throttles. - Stack Trace Parser - clean up the exception stack traces OpenTelemetry records as span events.
Related Guides
- OpenTelemetry Node.js Setup Guide - instrument a Node.js service end to end before choosing where the traces go.
- 7 Datadog Alternatives and What They Cost - the full-stack view when tracing is only one line on the bill.
- Best eBPF Observability Tools - get spans from services you cannot add an SDK to.
- Best Log Management Tools in 2026 - the same per-GB pricing comparison for logs.