
Every cluster has services nobody can instrument. A vendored Go binary with no build pipeline you control, a Python service whose owning team left, a Java app where adding an agent means a change window three weeks out. The SDK story assumes you can recompile and redeploy every one of them, and in a real fleet you cannot.
That gap is why eBPF instrumentation stopped being a curiosity. In 2026 the category's reference implementation changed hands: Grafana Labs donated Beyla, its eBPF auto-instrumentation agent, to the OpenTelemetry project, where it now lives as OpenTelemetry eBPF Instrumentation. The donation was announced at GrafanaCON 2025, and the first alpha came out of a collaboration between Grafana Labs, Splunk, Coralogix and Odigos. Version 0.13.0 shipped on September 4, 2026 under Apache 2.0. If you evaluated this space a year ago against a tool called Beyla, your notes are out of date.
What Does eBPF Instrumentation Actually Give You?
It gives you spans and RED metrics, rate, errors and duration, for traffic your services send and receive, without touching the code. The agent attaches probes in the kernel and reads the protocol on the wire, so it works on a binary you cannot rebuild.
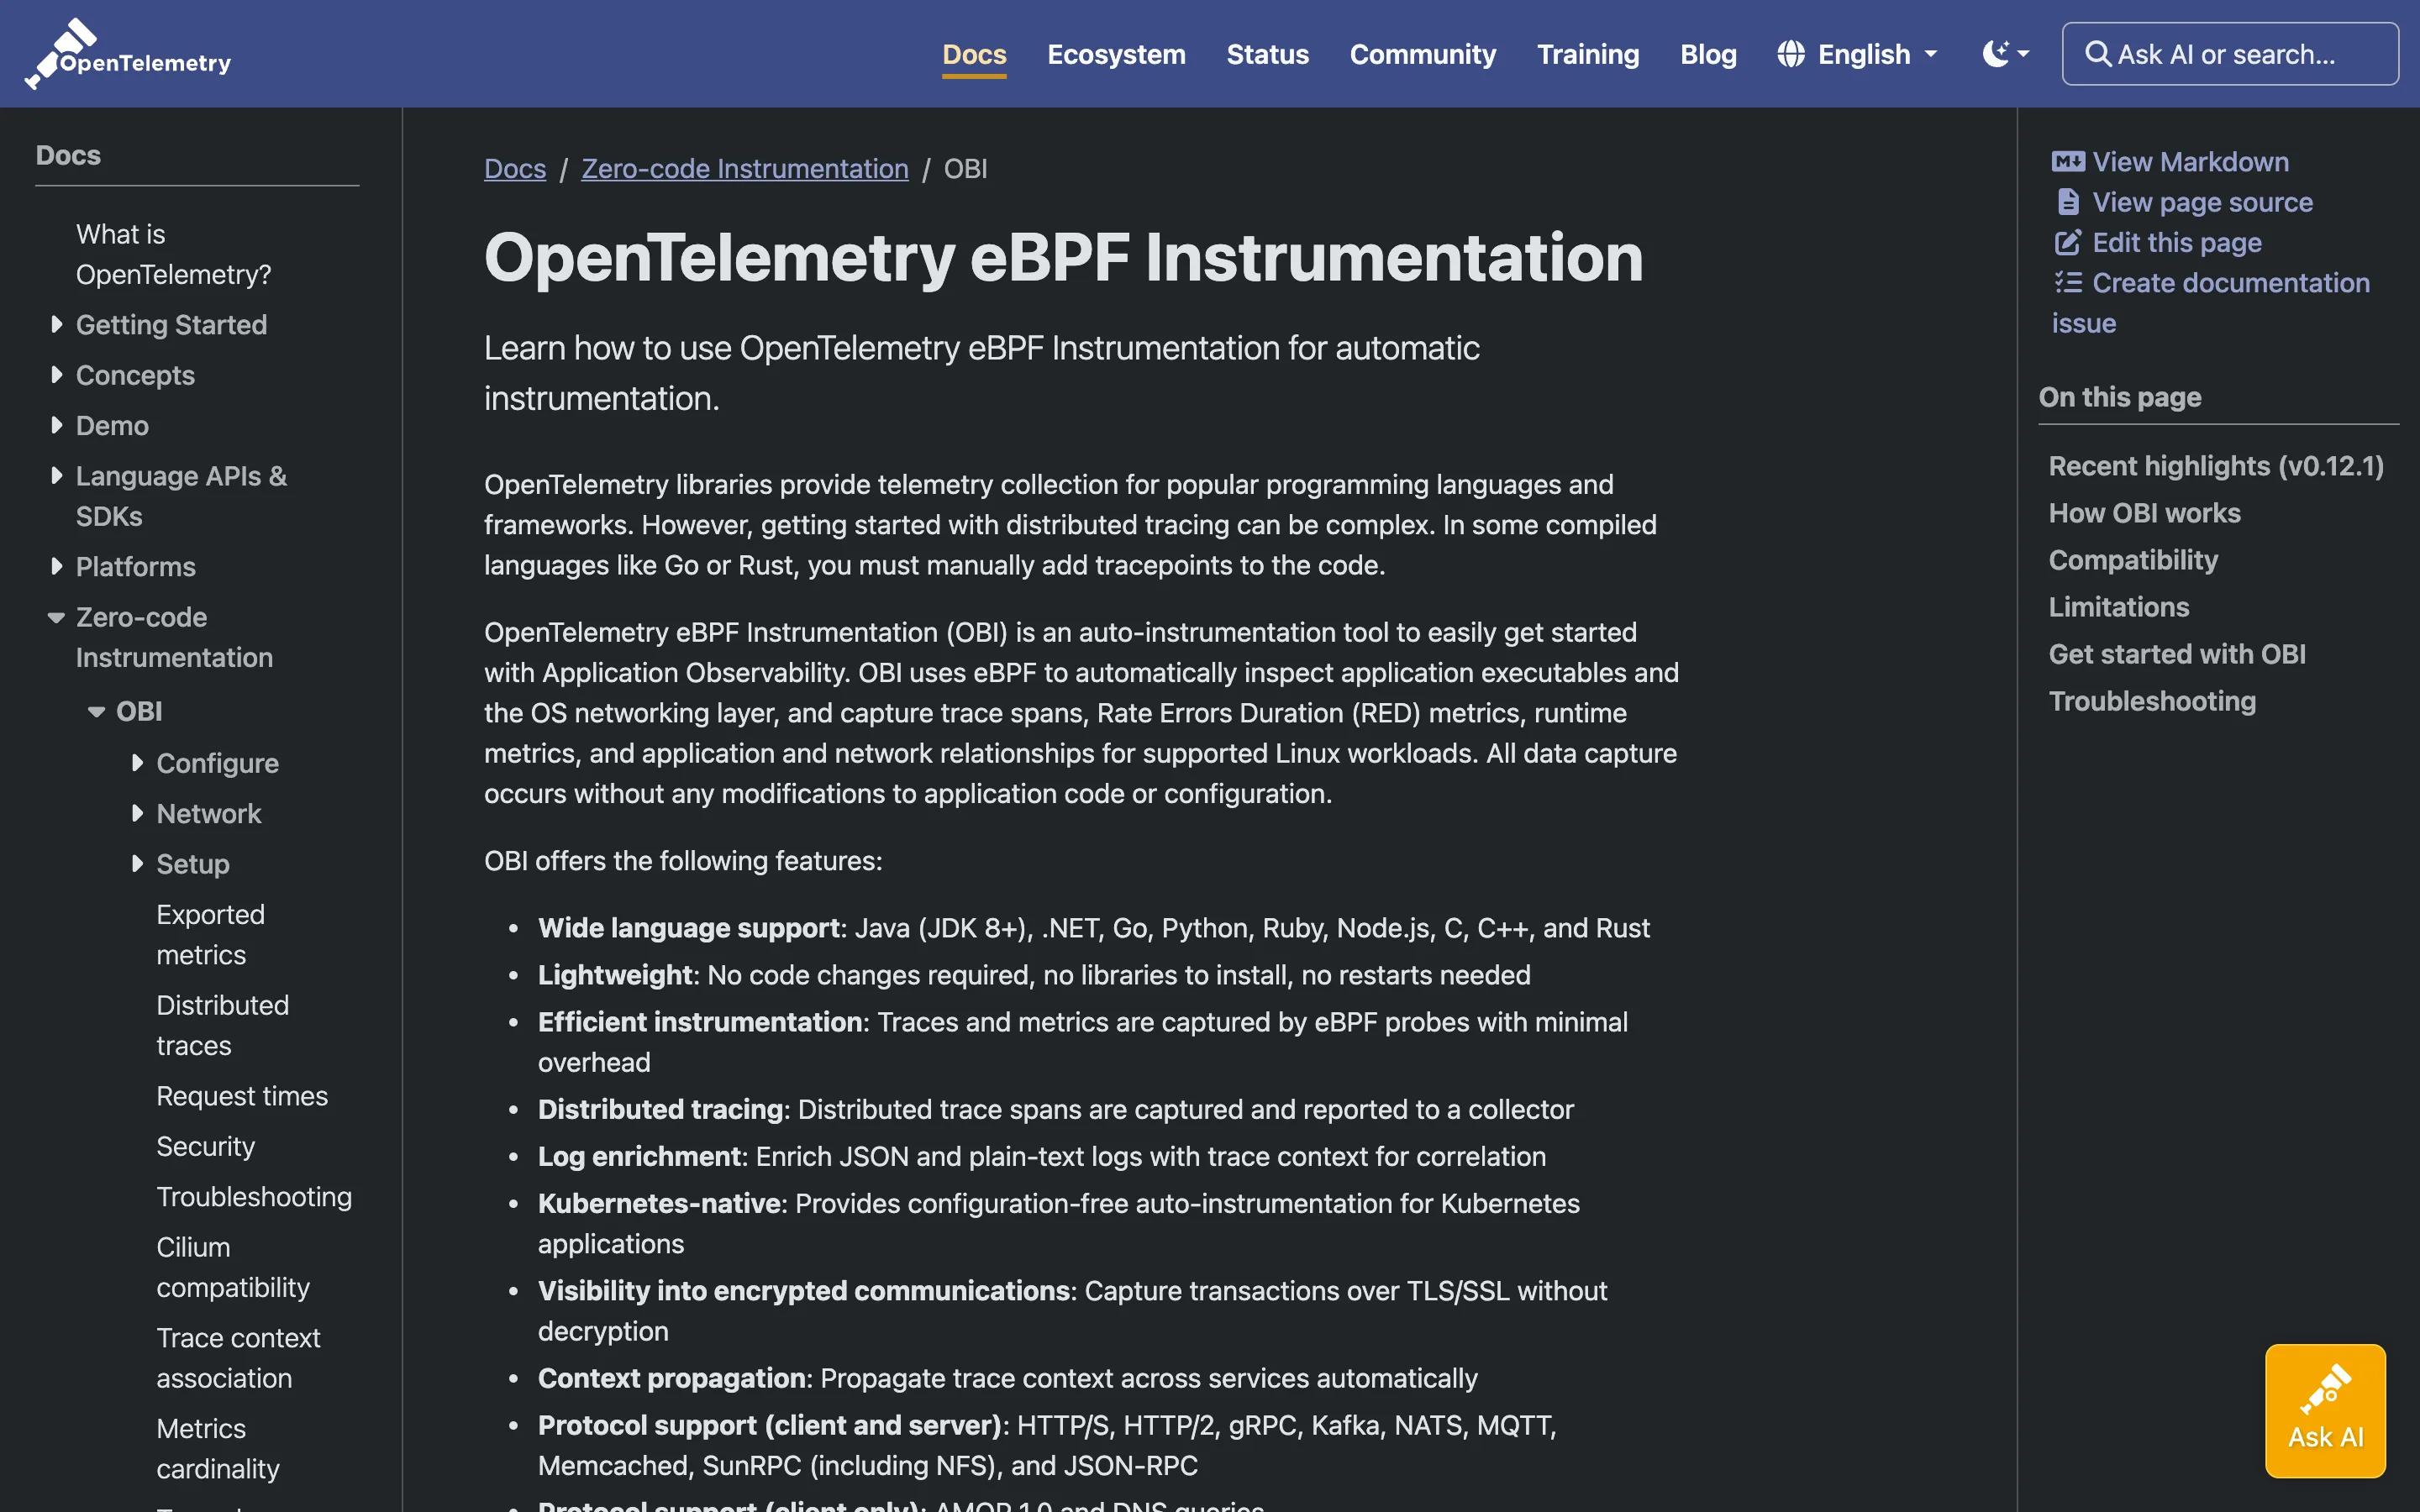
The OpenTelemetry eBPF Instrumentation documentation, checked September 8, 2026, states that data capture "occurs without any modifications to application code or configuration" and lists language support for Java (JDK 8+), .NET, Go, Python, Ruby, Node.js, C, C++ and Rust. Protocol coverage on both client and server side includes HTTP/S, HTTP/2, gRPC, Kafka, NATS, MQTT, Memcached, SunRPC including NFS, and JSON-RPC, with AMQP 1.0 and DNS queries client-side only. It also reports capturing transactions over TLS and SSL without decrypting them.
What it does not give you is meaning. eBPF sees a POST to /v2/checkout that took 240 milliseconds and returned 500. It does not see that the failure was a declined card rather than a database timeout, because that distinction lives in your business logic and never crosses a socket. Grafana Labs makes this argument itself in a post titled "Why OpenTelemetry instrumentation needs both eBPF and SDKs." Treat eBPF as the floor of coverage across everything, and SDK spans as the depth you add where the domain matters. If you want the SDK half, our OpenTelemetry Node.js setup guide covers it.
The Tools at a Glance
| Tool | What it collects | License and version, September 8, 2026 | Published price |
|---|---|---|---|
| OpenTelemetry eBPF Instrumentation | Spans, RED metrics, network relationships | Apache 2.0, v0.13.0 | Free, self-hosted |
| Coroot | Metrics, logs, traces, profiles, service map | Apache 2.0, 1.26.0 | Community free; Standard $1 per core/mo |
| Odigos | Distributed traces, OTLP to any backend | Apache 2.0, v1.36.0 | Free, self-hosted; commercial trial |
| Pixie | Full-body requests, metrics, profiles, in-cluster | Apache 2.0, CNCF Sandbox | Free, self-hosted |
| groundcover | Full-stack observability, bring your own cloud | Proprietary | $30 per node/mo (Pro) |
OpenTelemetry eBPF Instrumentation
OpenTelemetry eBPF Instrumentation, or OBI, is the one to start with if you already run an OpenTelemetry Collector, because it is a producer rather than a platform. It emits OTLP and stops there, so it slots in front of whatever backend you already pay for.
Two caveats matter. It is still pre-1.0 at v0.13.0, and the release notes read like it: v0.12.2 on August 22, 2026 was an expedited patch for a log-enricher defect that could deadlock instrumented shell workloads. Its own documentation carries a Limitations page, which is worth reading before you commit. Grafana Beyla has not disappeared either; it continues as Grafana Labs' distribution of upstream OBI, with Beyla 2.5 the first release to vendor most of the upstream code. Pick OBI if you want the vendor-neutral upstream, Beyla if you want Grafana's packaging of it.
Coroot
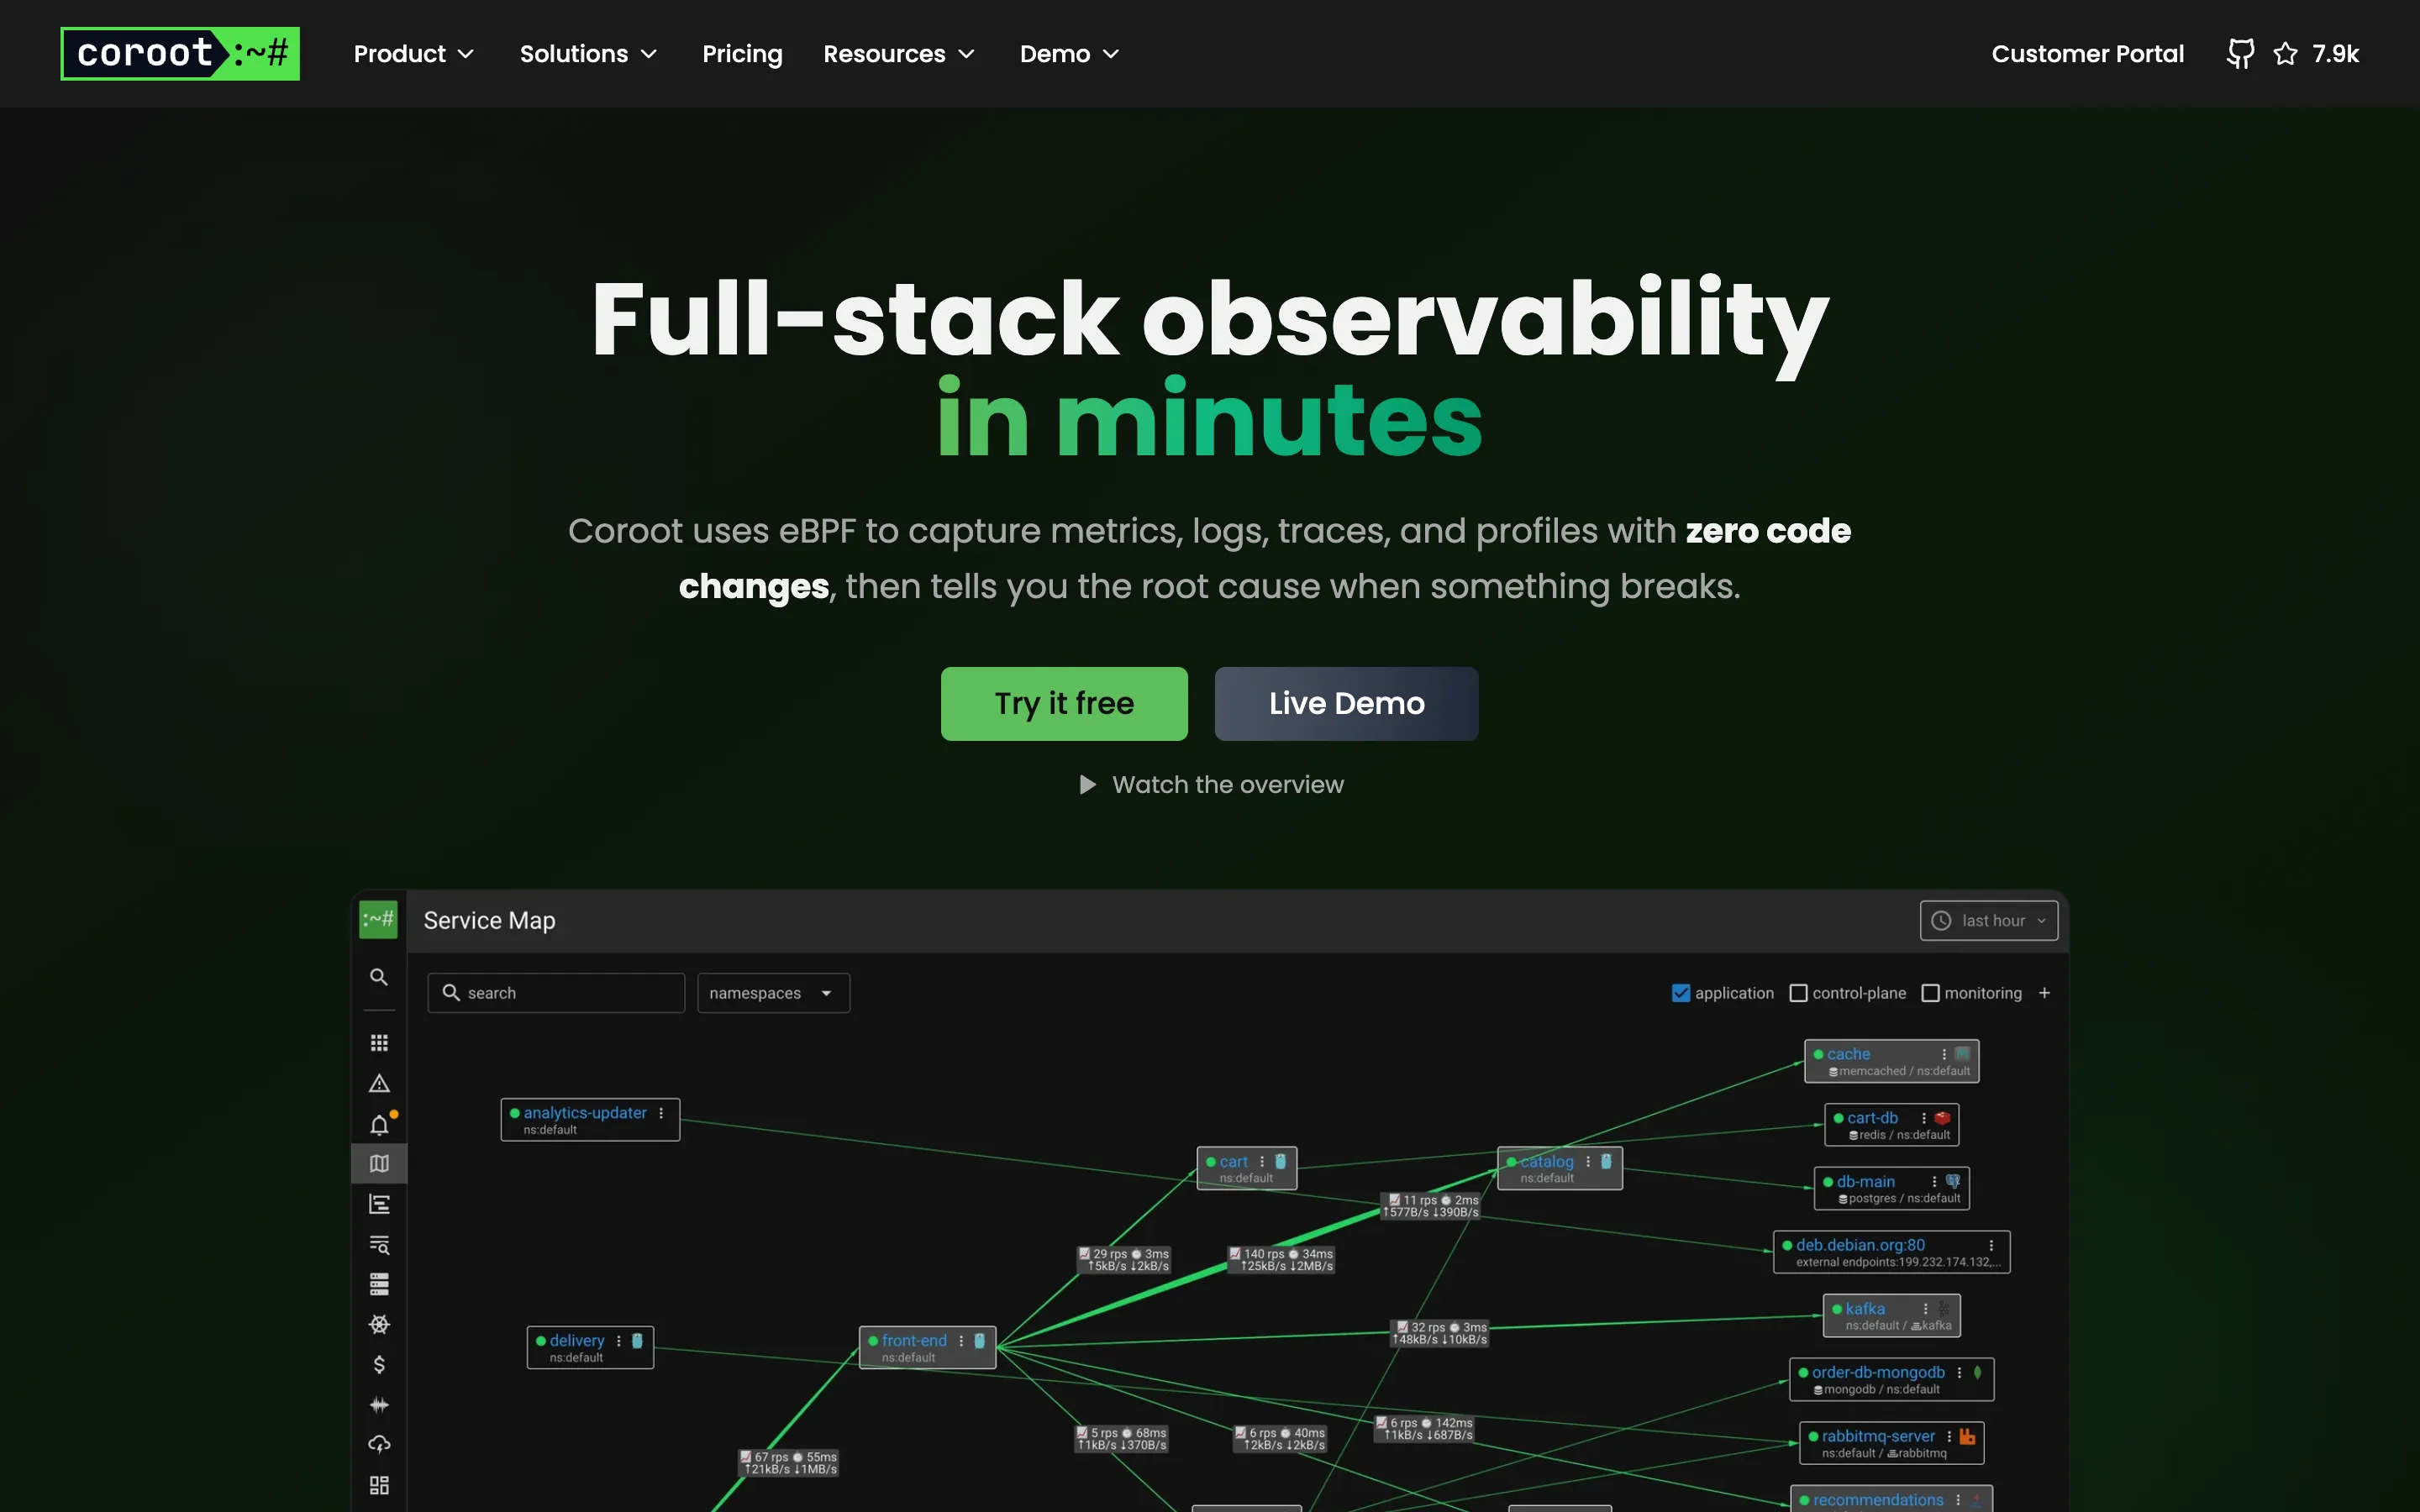
Coroot is the most complete of the open-source options, and the only one here that collects all four signals from eBPF. Its homepage states that it uses eBPF to capture metrics, logs, traces and profiles with zero code changes, then identifies the root cause when something breaks. Release 1.26.0 landed on September 7, 2026 under Apache 2.0, and the repository has roughly 7,900 stars.
The differentiator is the service map. Because the agent sees every socket, the map includes dependencies you never declared: the external endpoint a library calls, the Redis instance a legacy service still talks to. Coroot claims coverage with no blind spots, which is a fair description of what socket-level capture gets you. Pricing is unusual for this category and worth noting because it is metered on compute rather than hosts: the Standard plan is $1 per monitored CPU core per month, with Premium quoted by sales, and the Community edition is free and self-hosted.
Odigos
Odigos is the narrowest and, for one specific job, the best. Its README describes instant tracing with no code changes across Java, Python, .NET, Node.js and Go, and it makes a point that matters: compiled languages like Go are historically hard to instrument without code changes, which is exactly where eBPF earns its keep. Version 1.36.0 shipped on September 6, 2026 under Apache 2.0, and v1.37.0 was already tagged as a pre-release on September 8, 2026. The repository has about 3,700 stars.
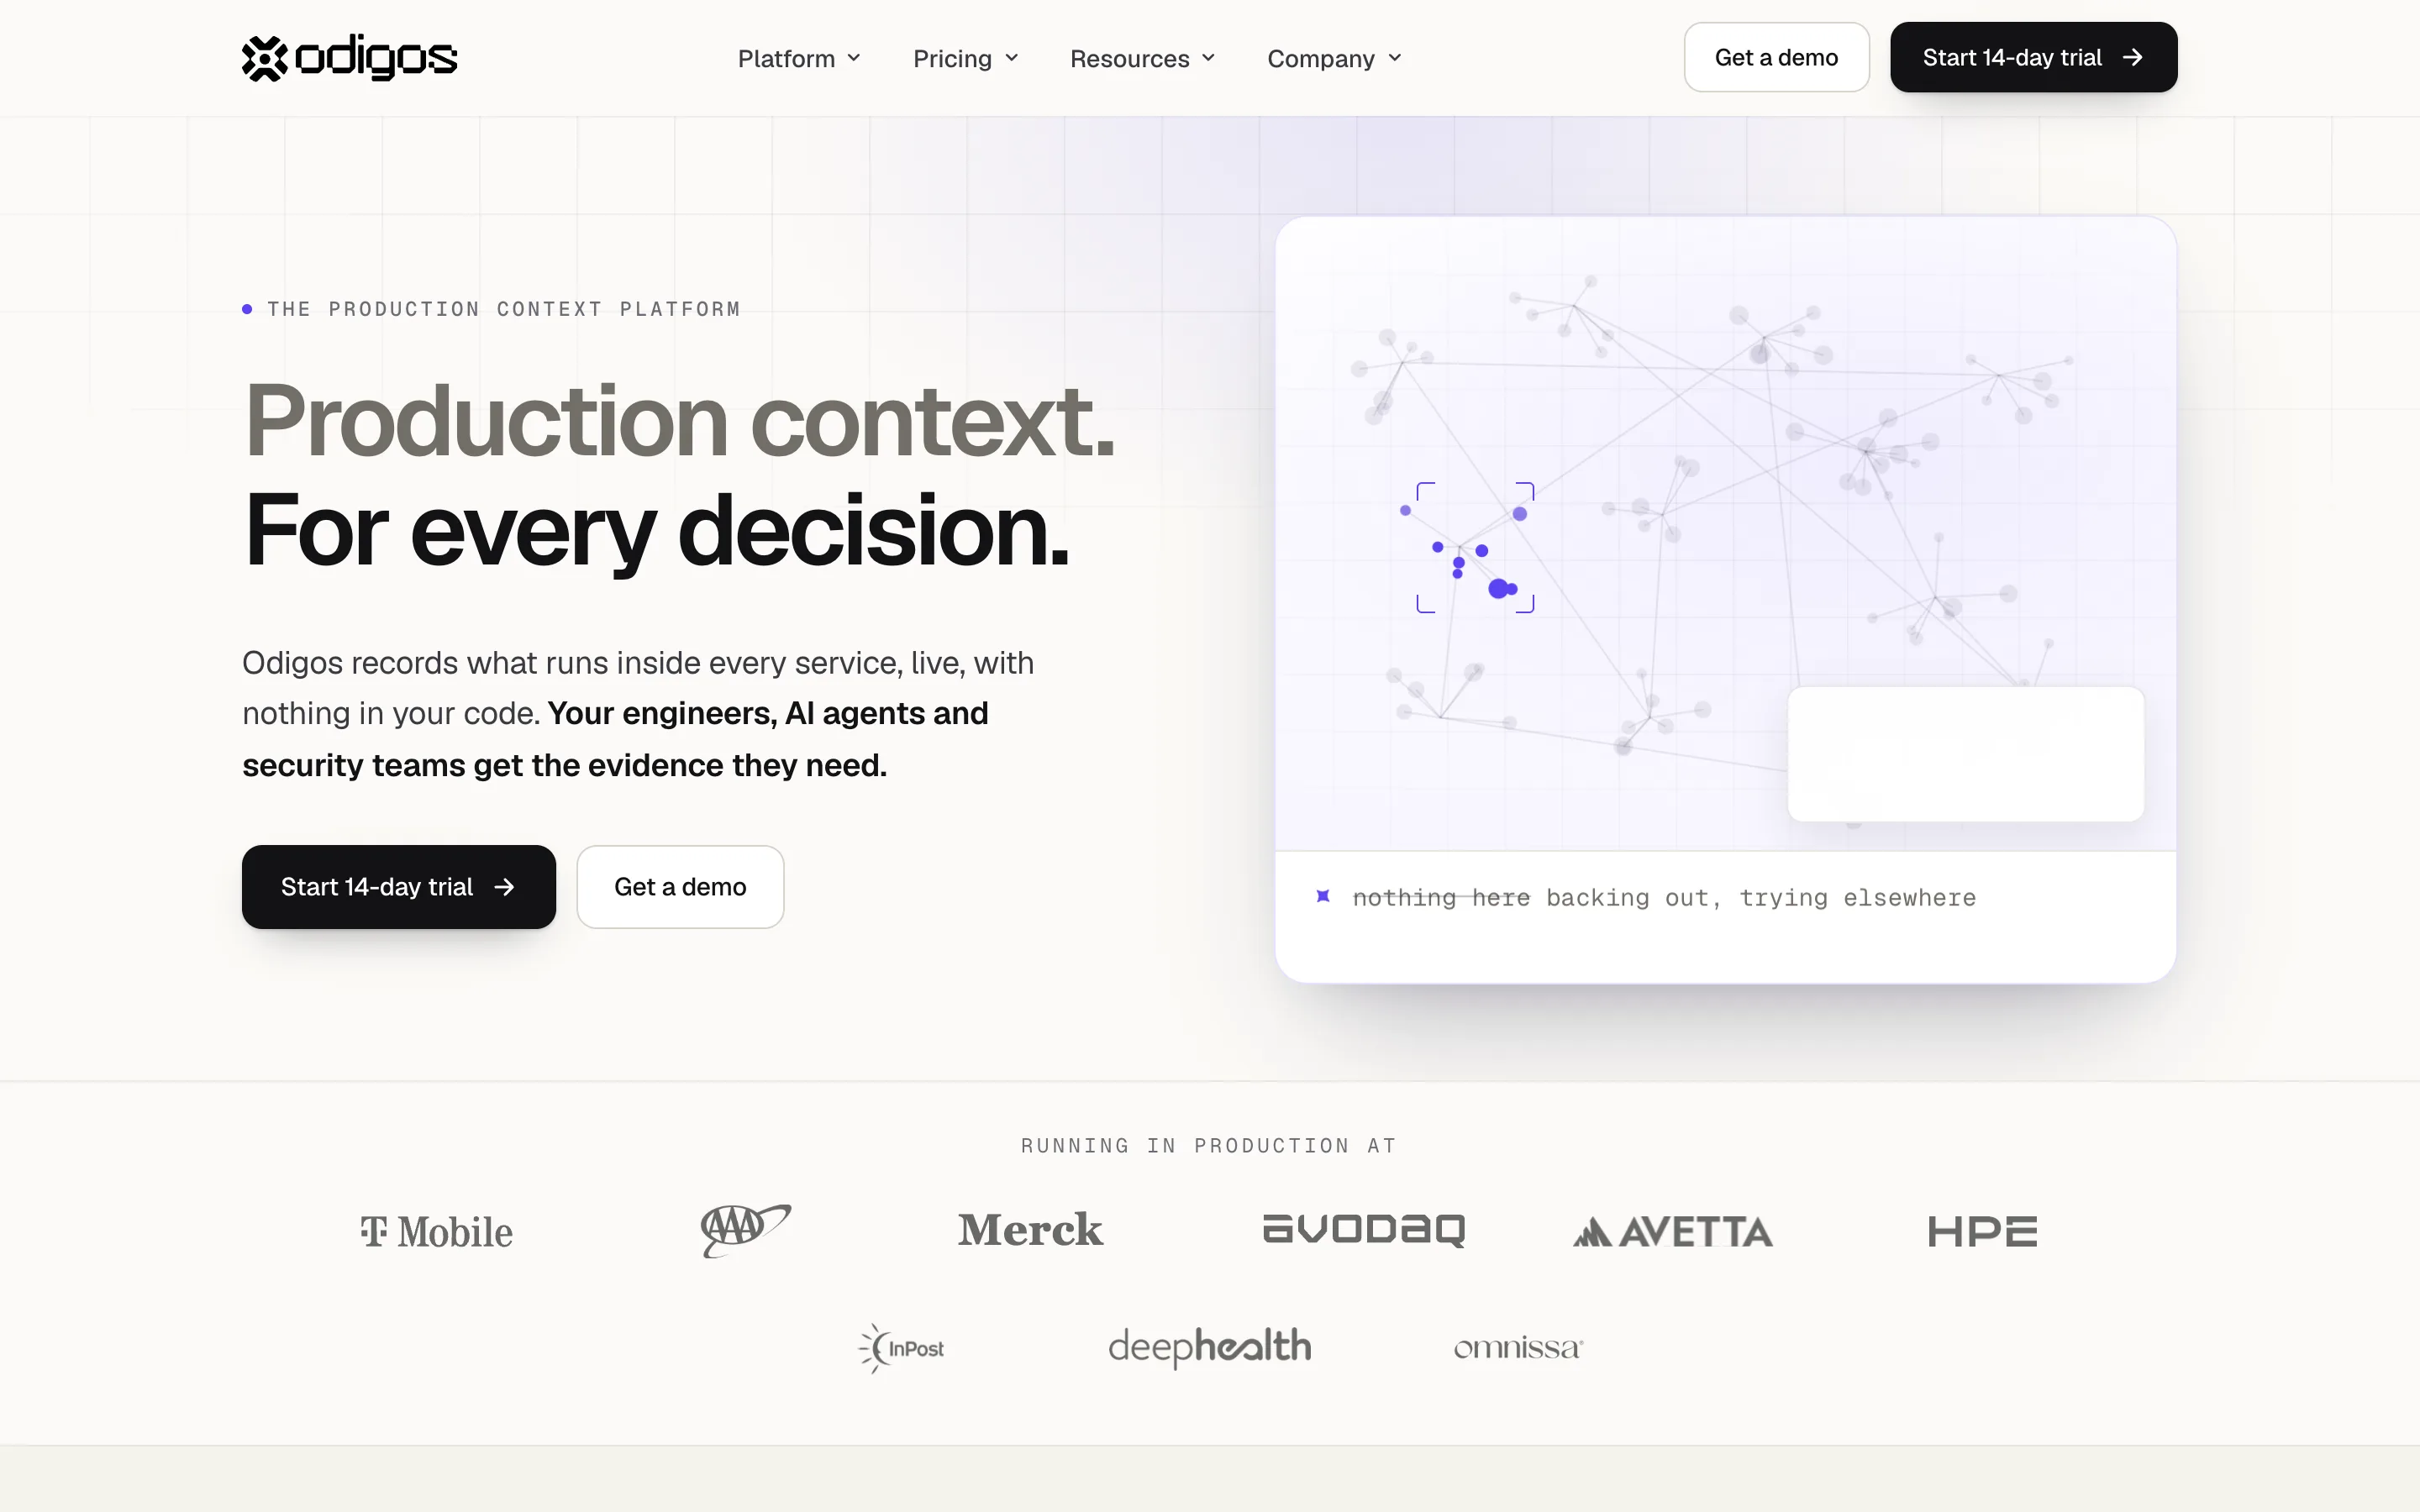
One thing to know before you evaluate it: the project and the company have diverged in how they describe themselves. The GitHub README still sells distributed tracing without code changes, while odigos.io now leads with "the production context platform" and a 14-day trial, naming T-Mobile, Merck and HPE as production users. The open-source agent is real and Apache 2.0, but treat the website as describing a commercial product built on top of it.
Pixie
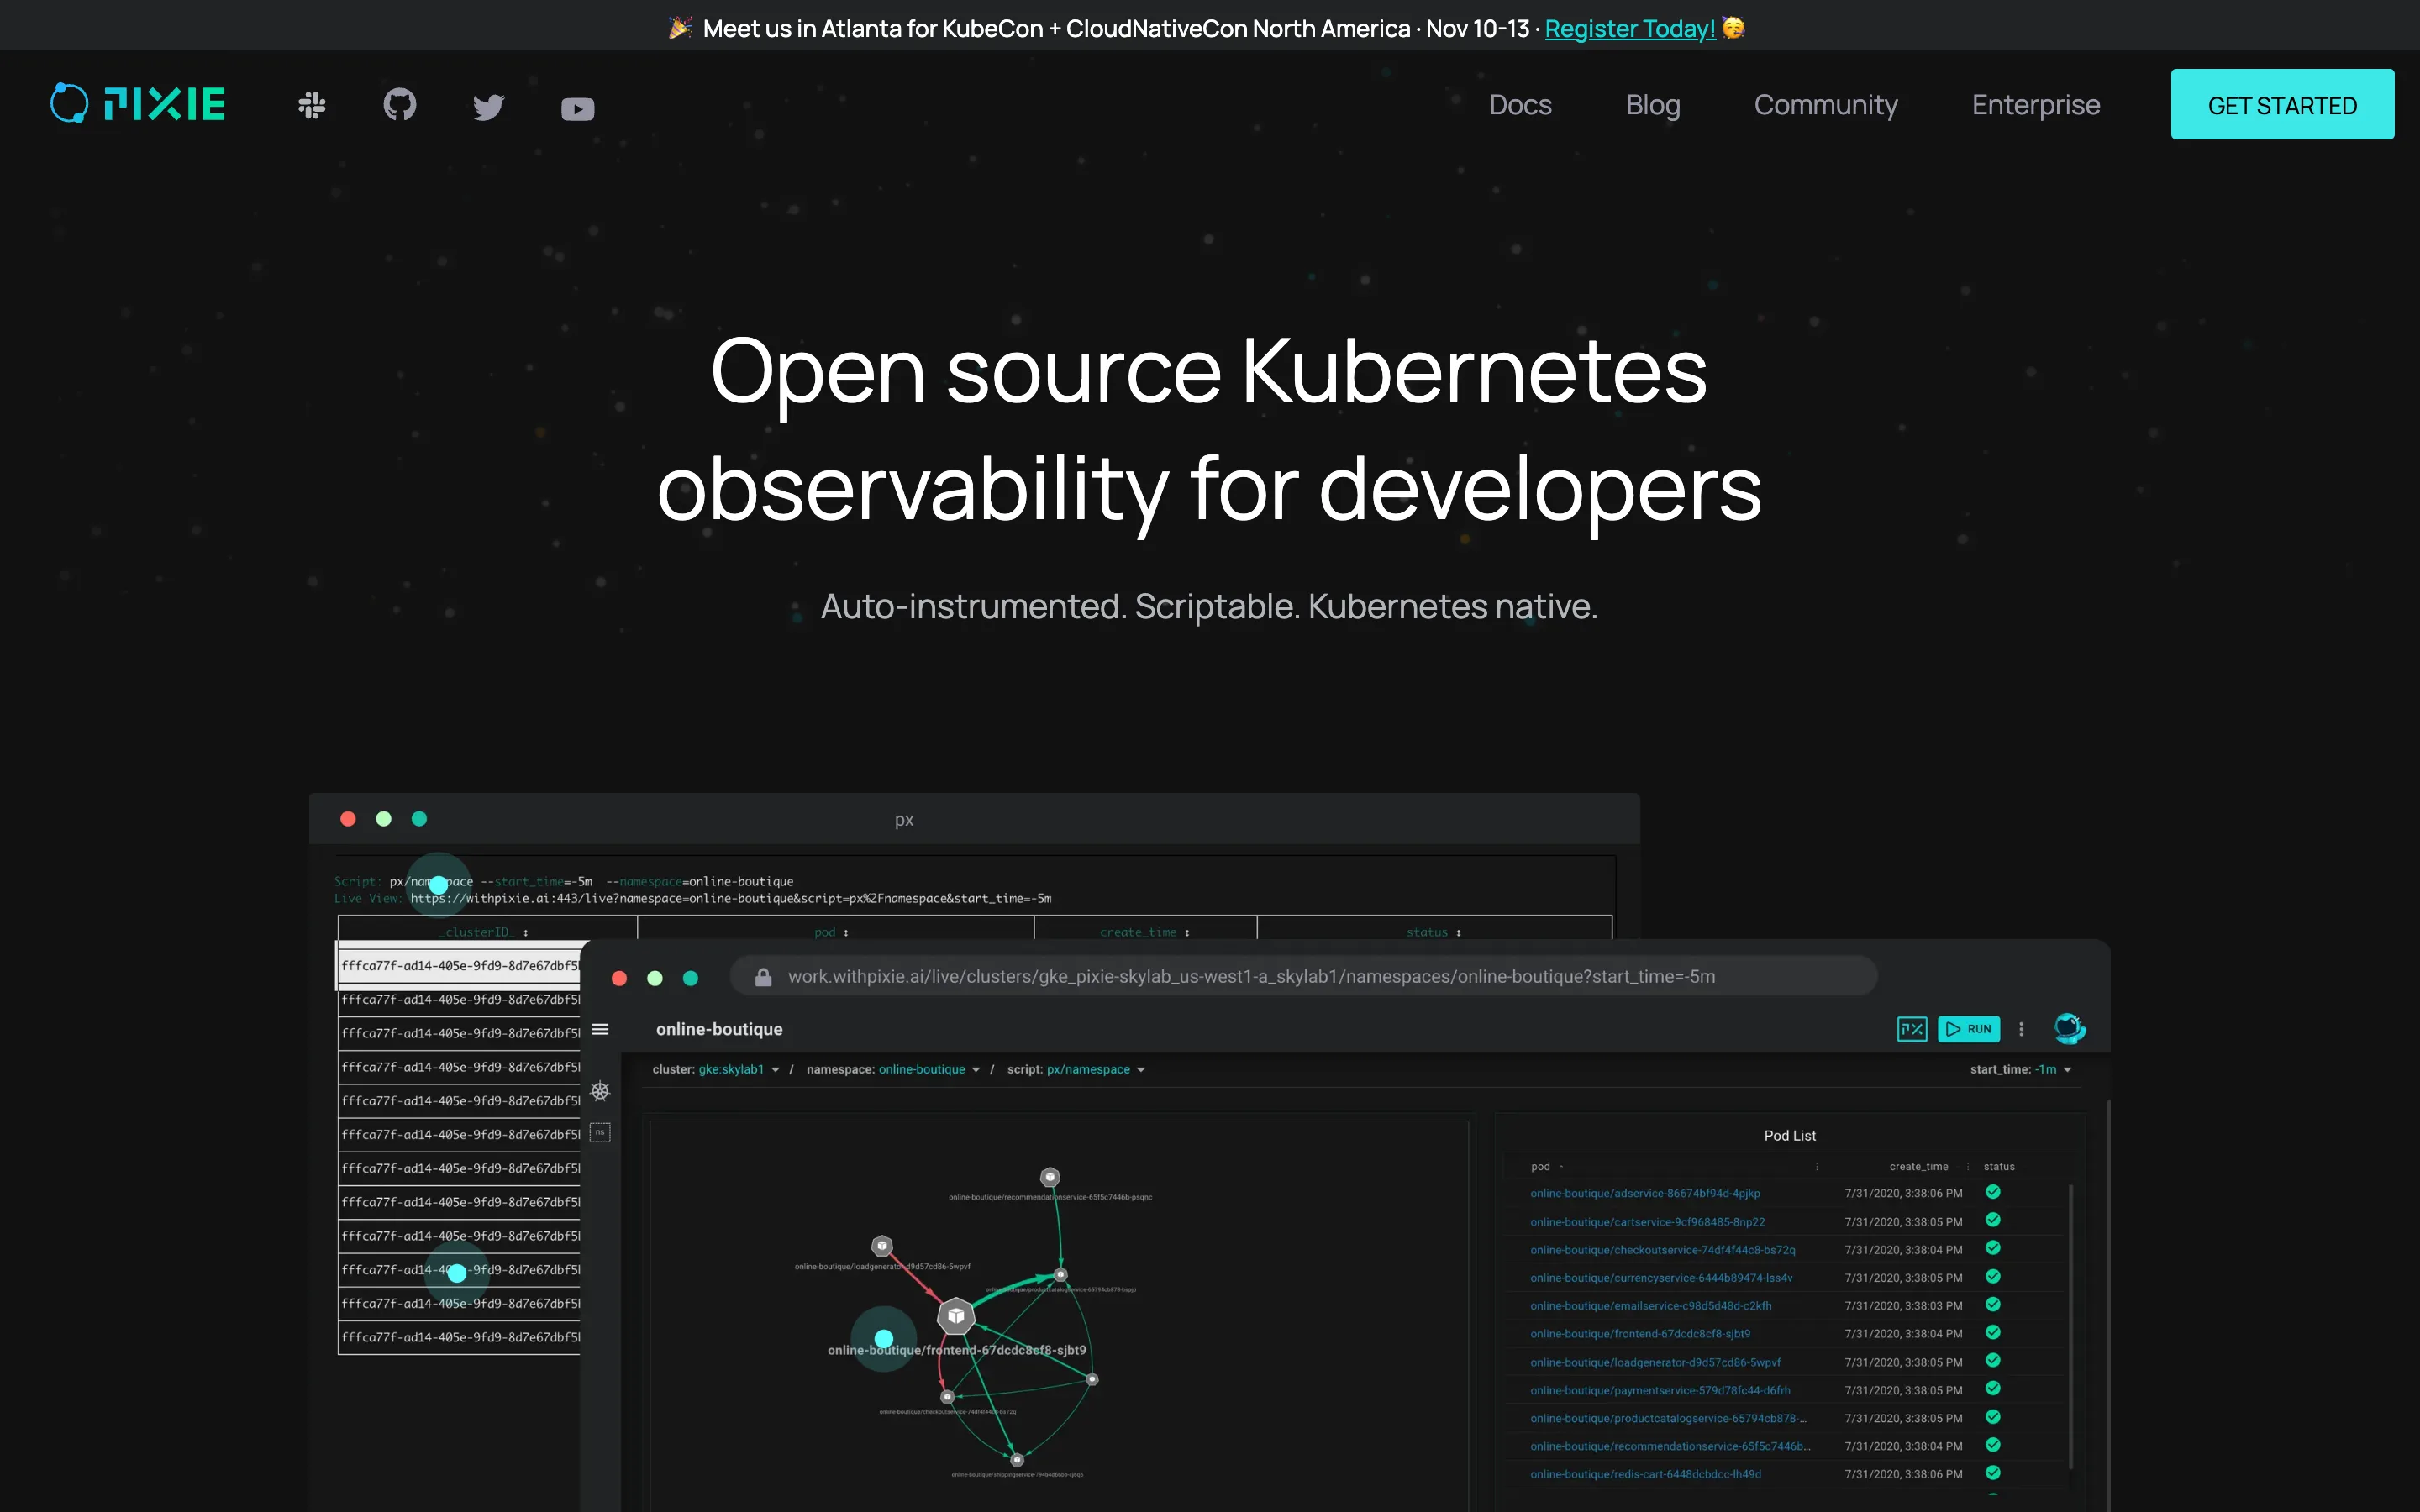
Pixie does something the others do not: it keeps the data in your cluster. It was contributed by New Relic to the Cloud Native Computing Foundation in June 2021, is Apache 2.0 licensed, and has around 6,500 stars. It captures full-body requests, resource and network metrics and application profiles, stores and queries all of it locally, and its own documentation puts the cost at under 5 percent of cluster CPU and in most cases under 2 percent. On a 50-node cluster with 8 vCPU per node, that arithmetic is 8 to 20 cores of the 400 you have.
Full-body request capture makes Pixie the strongest live-debugging tool in this list, and local storage makes it the easiest to justify where data residency is the blocker. The caution is momentum: Pixie was accepted as a CNCF Sandbox project on June 22, 2021 and remains at Sandbox maturity more than five years later, with recent activity arriving as component pre-releases rather than a unified version. It is maintained, not accelerating.
groundcover
groundcover is the commercial answer, and its pitch is architectural rather than feature-led: the platform is deployed in your cloud so telemetry never leaves it, which the site frames as full visibility without your data ever leaving your cloud. That removes the egress and residency objection that usually kills a hosted vendor in regulated environments.
Prices are published, which is rare enough to be a selling point. The Free tier is $0 with 12-hour retention, Pro is $30 per host per month, Enterprise is $35, and a fully on-premises deployment is $50. The metered unit is the monthly average number of Kubernetes nodes actively monitored by the eBPF sensor, which is a more predictable meter than per-host plus per-custom-metric plus per-ingested-gigabyte.
What This Costs Against Datadog
Here is the arithmetic for one 50-node cluster at 8 vCPU per node, using list prices each vendor publishes on its own pricing page, all checked September 8, 2026. Datadog's own page lists Infrastructure Pro at $15 per host per month billed annually and APM at $36, so $51 per host for the pair.
Scenario: 50 Kubernetes nodes, 8 vCPU each (400 cores)

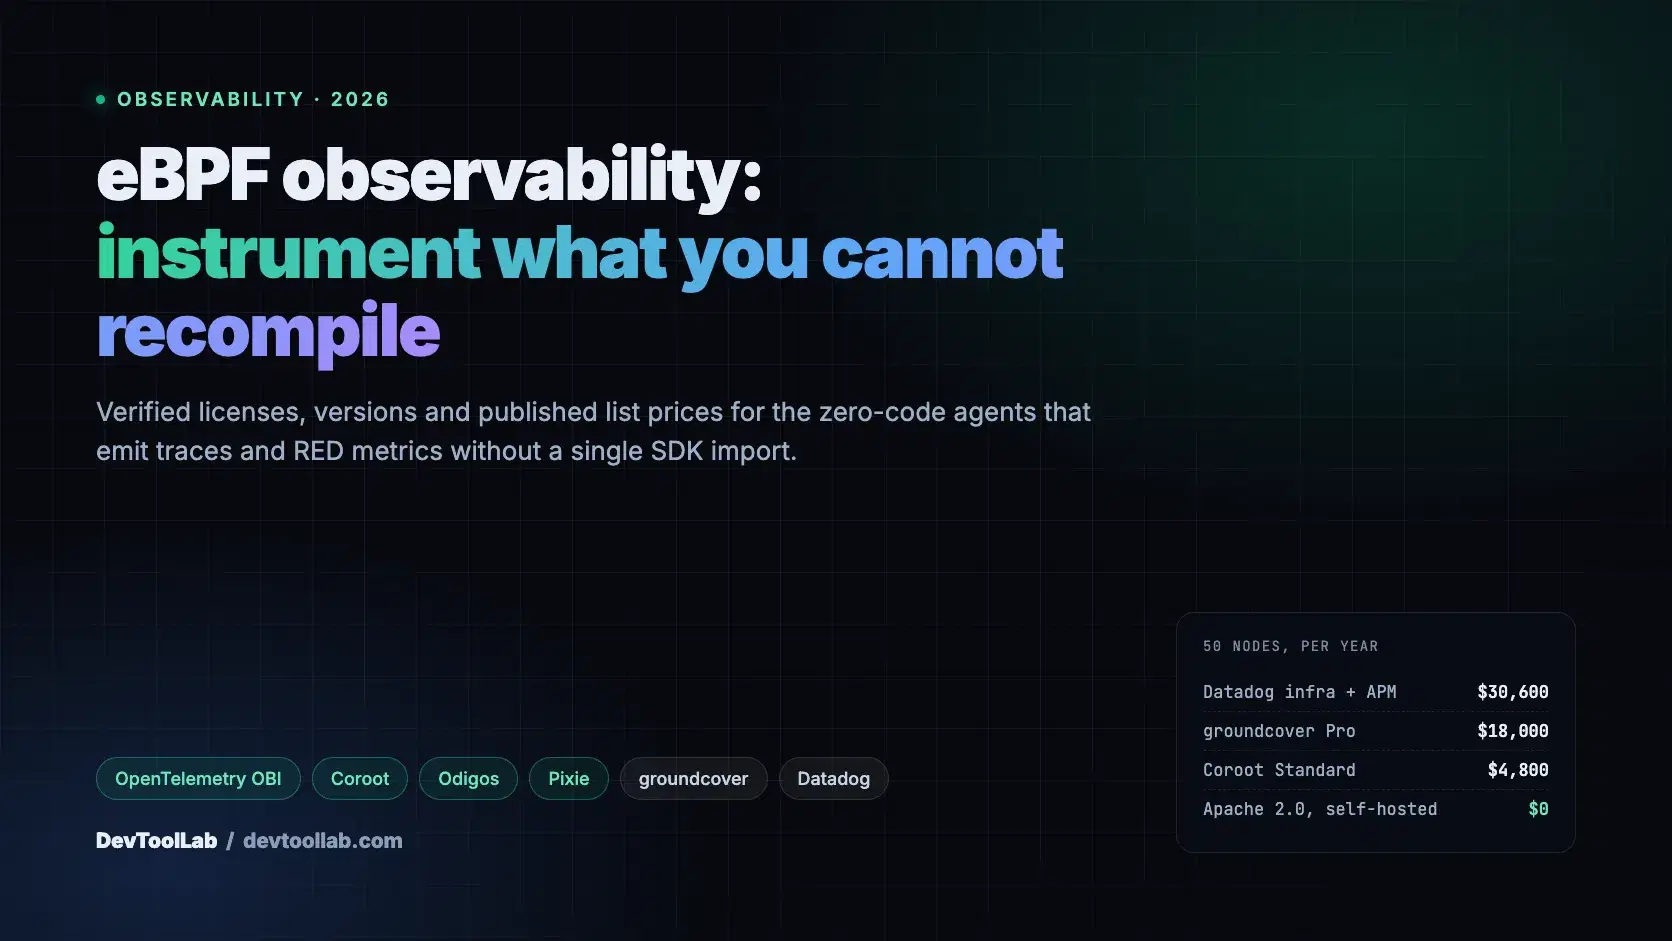
  Datadog Infrastructure Pro + APM  $15 + $36 per host/mo (annual)   $ 2,550/mo   $ 30,600/yr
  Datadog, same two on-demand       $18 + $48 per host/mo            $ 3,300/mo   $ 39,600/yr
  groundcover Pro                   $30 per node/mo                  $ 1,500/mo   $ 18,000/yr
  groundcover Enterprise            $35 per node/mo                  $ 1,750/mo   $ 21,000/yr
  groundcover On Premise            $50 per node/mo                  $ 2,500/mo   $ 30,000/yr
  Coroot Standard                   $1 per monitored core/mo         $   400/mo   $  4,800/yr
  OBI / Odigos / Coroot CE / Pixie  Apache 2.0, self-hosted          $     0/mo   $      0/yr

  Datadog annual vs Coroot Standard annual: $30,600 vs $4,800
  Multiple: 6.4x
Two honest caveats on that table. Datadog's $0.10 per ingested gigabyte for logs is excluded because volume is workload-specific, and it is usually the line that actually surprises people. And the $0 row is a license cost, not a total: you still pay for the storage backend, and for the engineer who owns it. The one measured overhead figure any vendor here publishes is Pixie's, at 2 to 5 percent of cluster CPU.
How to Get Traces Without Touching Your Code
OBI runs as a DaemonSet, one instance per node, instrumenting every workload it finds. This manifest follows the unprivileged pattern from the OpenTelemetry Kubernetes setup documentation, using discrete Linux capabilities instead of privileged: true, and pins the image rather than tracking main.
yamlapiVersion: apps/v1 kind: DaemonSet metadata: name: obi namespace: observability spec: selector: matchLabels: k8s-app: obi template: metadata: labels: k8s-app: obi spec: serviceAccount: obi hostPID: true containers: - name: obi image: otel/ebpf-instrument:v0.13.0 env: - name: OTEL_EBPF_KUBE_METADATA_ENABLE value: "autodetect" - name: OTEL_EBPF_AUTO_TARGET_EXE value: "*" - name: OTEL_EXPORTER_OTLP_ENDPOINT value: http://otel-collector.observability.svc.cluster.local:4318 securityContext: runAsUser: 0 readOnlyRootFilesystem: true capabilities: add: - BPF - SYS_PTRACE - NET_RAW - CHECKPOINT_RESTORE - DAC_READ_SEARCH - PERFMON drop: - ALL volumeMounts: - name: var-run-obi mountPath: /var/run/obi - name: cgroup mountPath: /sys/fs/cgroup volumes: - name: var-run-obi emptyDir: {} - name: cgroup hostPath: path: /sys/fs/cgroup
Three things decide whether this works on the first try. The ServiceAccount needs a ClusterRole that can list and watch Pods, ReplicaSets, Services and Nodes, or the Kubernetes metadata decoration silently produces unlabeled spans. OTEL_EBPF_AUTO_TARGET_EXE set to * instruments every process rather than making you name executables, which is what you want on a node-wide DaemonSet and not what you want on a sidecar. And on large clusters, deploy the optional k8s-cache service and point OBI at it with OTEL_EBPF_KUBE_META_CACHE_ADDRESS, because every agent otherwise queries the API server directly.
Which One Should You Actually Use?
Already running an OpenTelemetry Collector: OpenTelemetry eBPF Instrumentation. It produces OTLP and nothing else, so it adds coverage without adding a platform. Read its Limitations page first, since it is still 0.x.
Want one thing to install and get a service map: Coroot. It is the only Apache 2.0 option here collecting metrics, logs, traces and profiles together, and $1 per monitored core is the cheapest paid tier in this comparison by a wide margin.
Mostly Go services you cannot rebuild: Odigos, which targets exactly the compiled-language case that defeats SDK-based instrumentation.
Data cannot leave the cluster: Pixie, which stores and queries locally at a published 2 to 5 percent CPU cost. Accept that it has sat at CNCF Sandbox since June 2021.
Want a supported product with a predictable bill: groundcover at $30 per node per month, deployed in your own cloud. It is the only vendor here publishing a per-node price you can multiply without a sales call.
Conclusion
eBPF changed what is reachable, not what is meaningful. It gets you RED metrics and a dependency map across an entire fleet in an afternoon, including the services no SDK will ever be added to, and the 2026 consolidation around OpenTelemetry eBPF Instrumentation means that floor is now vendor-neutral rather than one company's agent.
What it will not do is tell you why a checkout failed. Instrument broadly with eBPF because it is nearly free to deploy, then spend your SDK effort on the two or three services where a span needs to carry a domain fact. Teams that pick one and skip the other end up either blind to half their estate or drowning in spans that all say POST /api.
Related DevToolLab Tools
- Kubernetes YAML Generator - scaffold the DaemonSet and ServiceAccount above without hand-typing the boilerplate that eBPF agents need.
- YAML Validator - catch the indentation error in a capabilities block before
kubectl applyrejects it or, worse, accepts something wrong. - Kubernetes Secret Decoder - decode the base64 in an OTLP auth secret when the collector rejects the agent's headers.
- Helm Chart Generator - package the agent once and template the OTLP endpoint per cluster instead of maintaining a manifest per environment.