
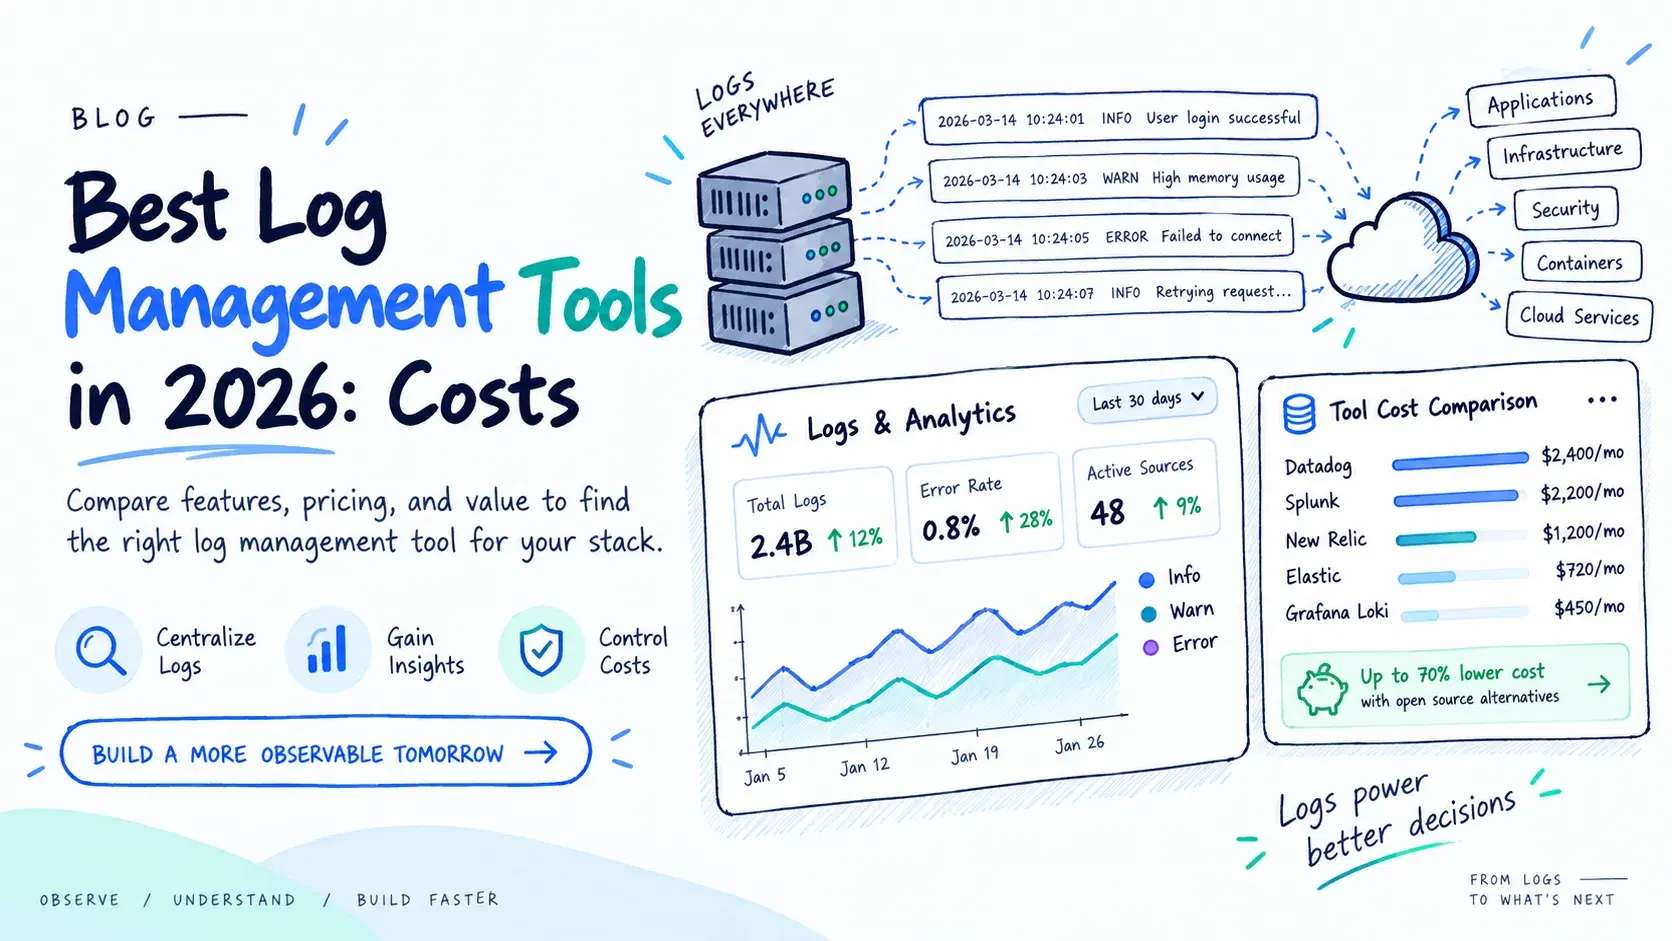
Logs are the one telemetry signal that grows with both your traffic and your headcount. Every new service and every retry storm writes more of them, and unlike metrics they do not aggregate away, so the invoice climbs even in a quiet quarter.
Priced against the vendors' own rate cards on September 23, 2026, the same 500 GB of monthly log ingest costs $43.50 on Elastic Cloud Serverless and $1,360.72 on Datadog with standard indexing. That is a 31x spread for identical data, and only $50 of the Datadog figure is ingestion. The rest is the index.
What Teams Actually Run
Grafana Labs published its 4th Annual Observability Survey on March 18, 2026, based on 1,363 responses from engineers, SREs and technology leaders across 76 countries.
Complexity and overhead topped the list of observability concerns for 2026, cited by 38% of respondents, ahead of signal-to-noise at 34% and cost at 31%. Half of all respondents now use SaaS for observability in some capacity, up from 43% in 2025.
The open source pull is stronger: 77% say open source or open standards matter to their strategy. OpenTelemetry is now in broad use across metrics (57%), traces (50%) and logs (48%), and that 48% is the number that matters here, because an OTel-native pipeline is what makes the migrations below survivable.
What 500 GB a Month Actually Costs
The advertised per-GB numbers are not comparable, because these vendors meter different things. Datadog separates ingestion (per GB) from indexing (per million events, priced by retention tier). Grafana Cloud splits Write, Process and Retain into three GB meters. Elastic and Better Stack split ingestion from retained GB-months. A per-GB price without its unit is meaningless.
This script prices one workload against each rate card, all read from vendor pages on September 23, 2026.
jsconst GB_PER_MONTH = 500 const BYTES_PER_EVENT = 1024 // 1 KB average log line const MILLION_EVENTS = (GB_PER_MONTH * 1024 ** 3) / BYTES_PER_EVENT / 1e6 const rows = [ { vendor: 'Datadog (Standard Indexing)', meters: [ ['ingest', GB_PER_MONTH * 0.10], ['index 30d @ $2.50/M events', MILLION_EVENTS * 2.50]] }, { vendor: 'Datadog (Flex Logs Starter)', meters: [ ['ingest', GB_PER_MONTH * 0.10], ['flex starter @ $0.60/M events', MILLION_EVENTS * 0.60]] }, { vendor: 'Grafana Cloud Logs (Pro)', meters: [ ['platform fee', 19], ['write @ $0.400/GB', (GB_PER_MONTH - 50) * 0.400], ['process @ $0.050/GB', (GB_PER_MONTH - 50) * 0.050]] }, { vendor: 'Elastic Serverless (Logs Essentials)', meters: [ ['ingest @ $0.07/GB', GB_PER_MONTH * 0.07], ['retain @ $0.017/GB-mo', GB_PER_MONTH * 0.017]] }, ] const fmt = (n) => '$' + n.toLocaleString('en-US', { minimumFractionDigits: 2 }) for (const r of rows) { const total = r.meters.reduce((s, [, v]) => s + v, 0) console.log(r.vendor.padEnd(40), fmt(total).padStart(12), '/mo') for (const [label, v] of r.meters) console.log(' ', label.padEnd(34), fmt(v).padStart(10)) }
Real output:
textDatadog (Standard Indexing) $1,360.72 /mo ingest $50.00 index 30d @ $2.50/M events $1,310.72 Datadog (Flex Logs Starter) $364.57 /mo ingest $50.00 flex starter @ $0.60/M events $314.57 Grafana Cloud Logs (Pro) $221.50 /mo platform fee $19.00 write @ $0.400/GB $180.00 process @ $0.050/GB $22.50 Elastic Serverless (Logs Essentials) $43.50 /mo ingest @ $0.07/GB $35.00 retain @ $0.017/GB-mo $8.50
Indexing is 96% of the Datadog bill, which is why every Datadog cost conversation is really about what you choose not to index. The assumption worth arguing with is 1 KB per event: structured JSON logs often run 2 KB, which halves the event count and roughly halves that indexing line.
Datadog Logs
Datadog Log Management is what the market prices against, and its Logging without Limits design is why: ingestion and indexing are decoupled so you can send everything and index a subset.
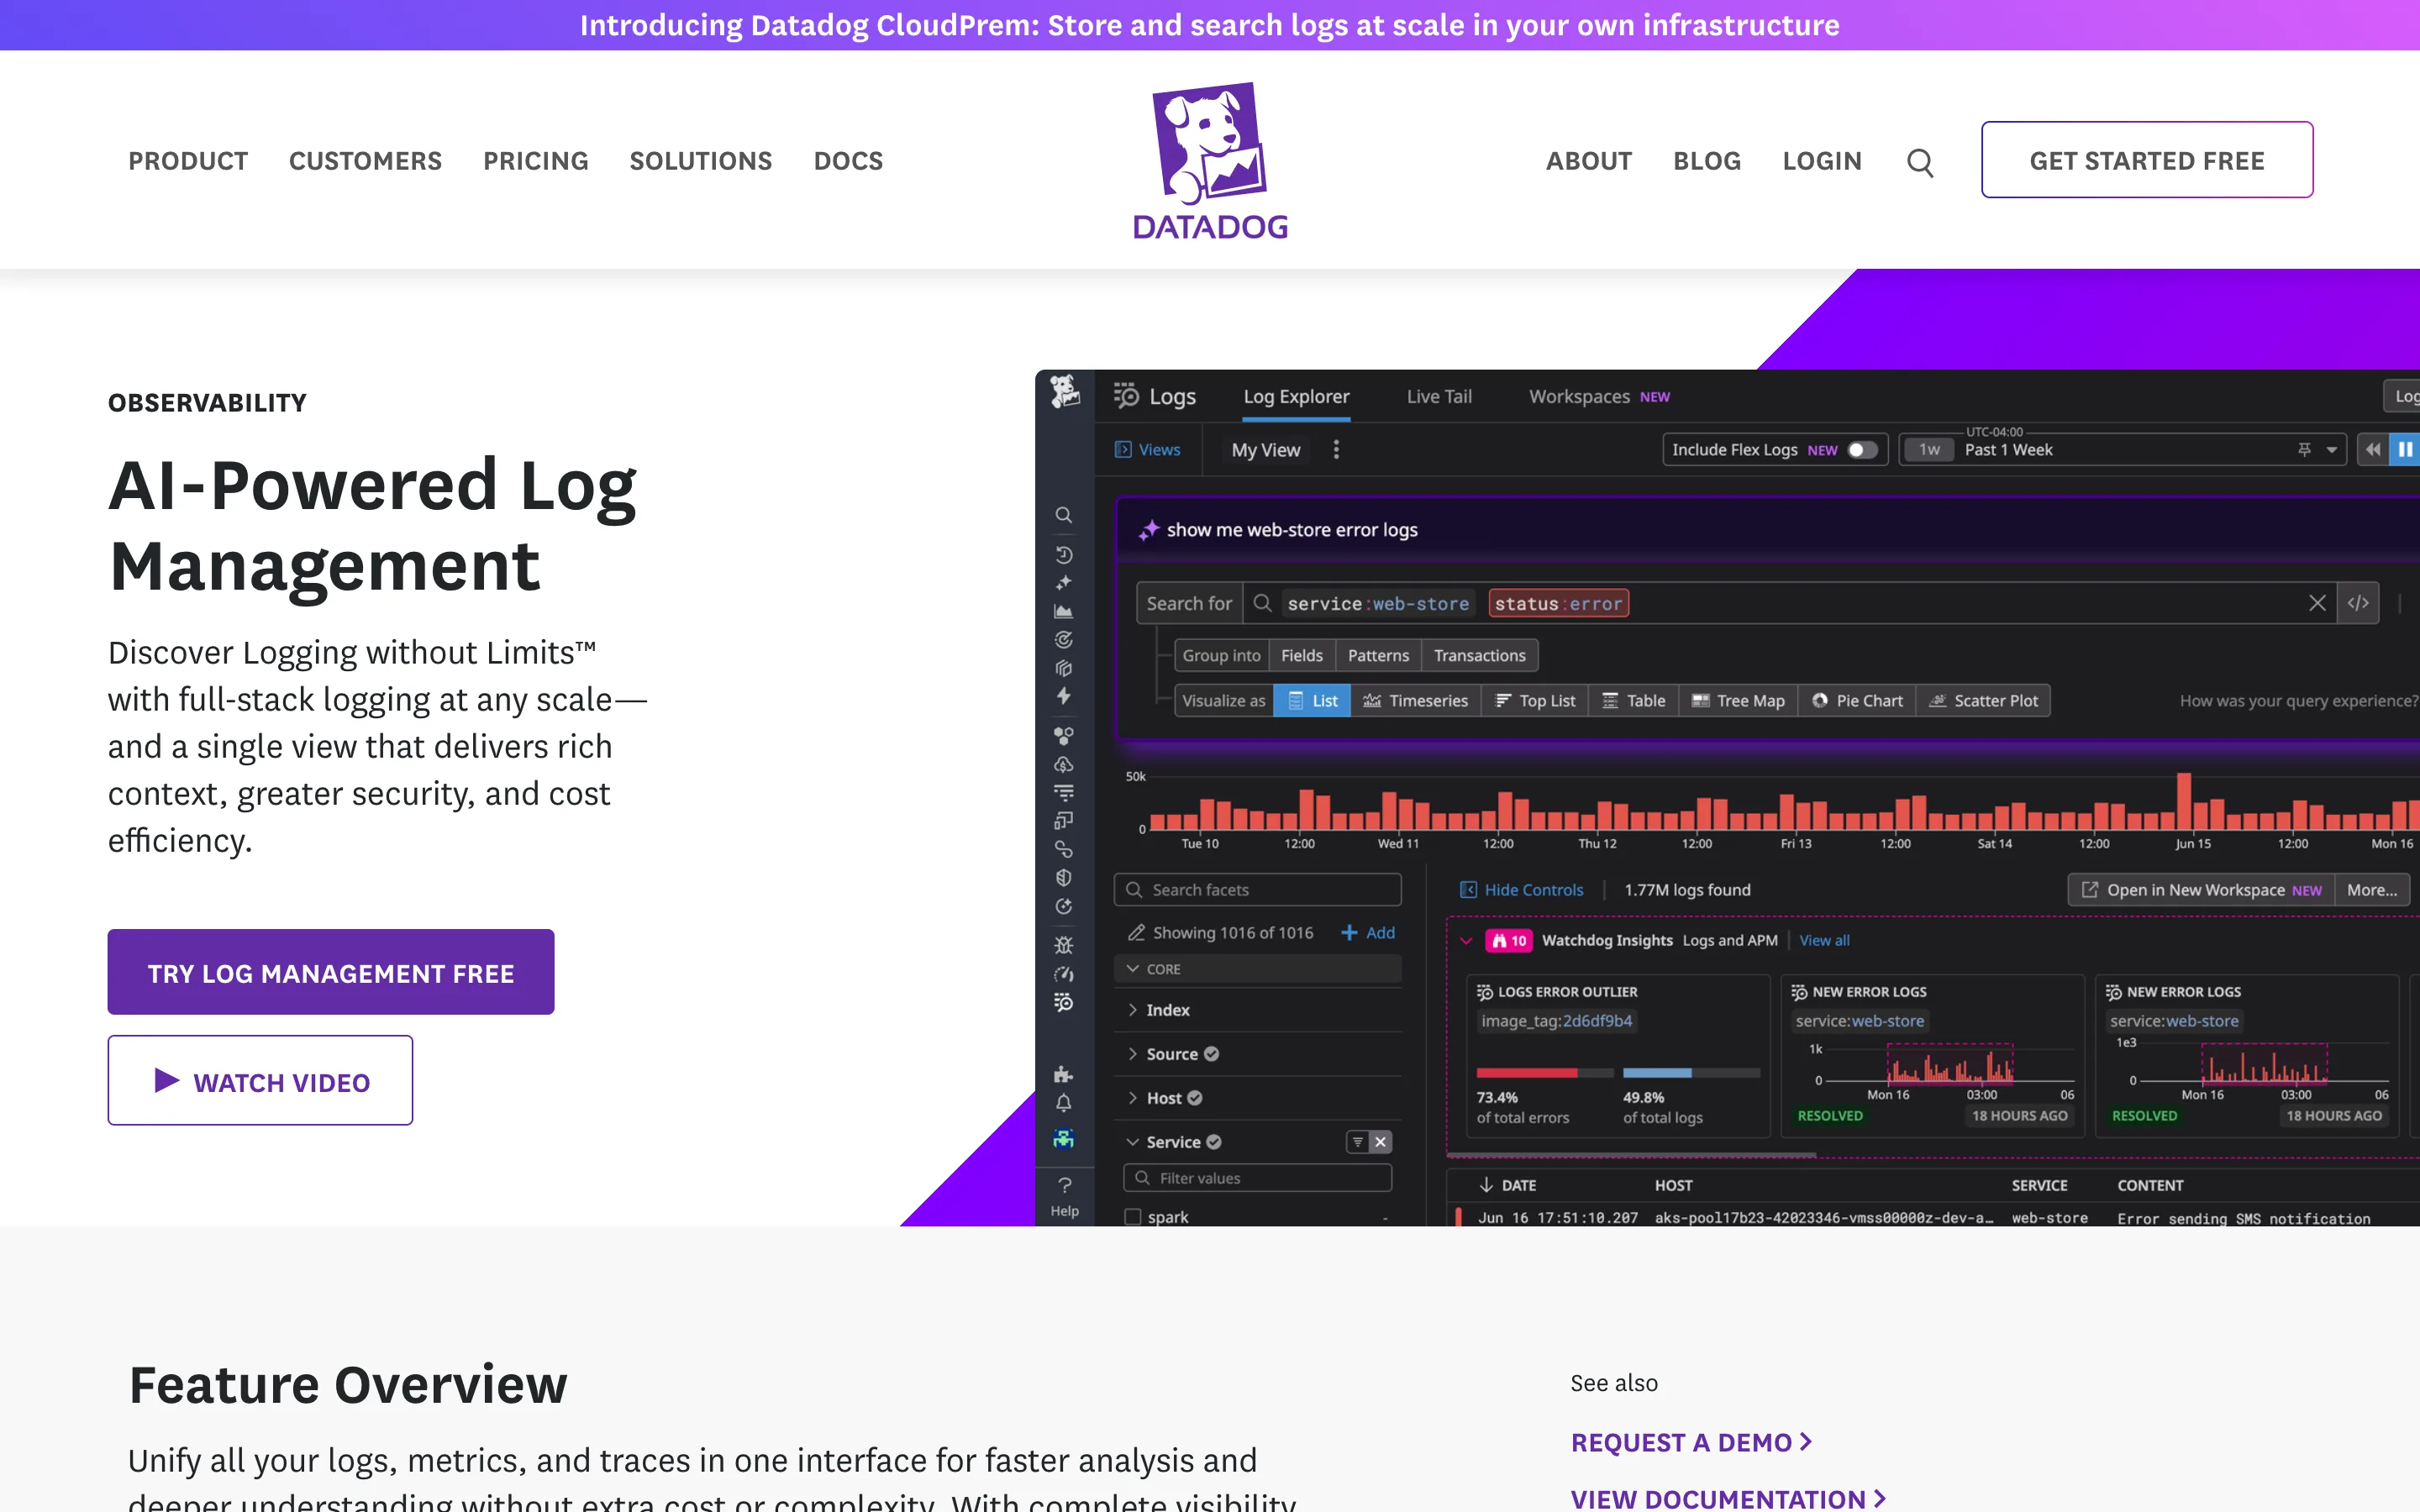
The correlation story is the real product: logs sit beside APM traces and metrics in one interface, and Watchdog surfaces error outliers without a query. Flex Logs at $0.60 per million events against $2.50 for 30-day standard indexing is a genuine answer to the archive-versus-search tradeoff, and as of September 23, 2026 the site also promotes CloudPrem for storing logs in your own infrastructure.
What it does not do is let you predict the bill. Two meters with different units, retention-tiered index pricing and regional variation (ingest is $0.10 in the US, $0.12 in the EU) mean the invoice moves when traffic patterns shift, not only when volume does.
Pricing: $0.10/GB ingest · 30-day index $2.50/M events annual, $3.75 on demand · Flex Starter $0.60/M events · no free tier
Better Stack
Better Stack sells the opposite proposition: bundled plans with a predictable monthly number, aimed squarely at Datadog invoices.
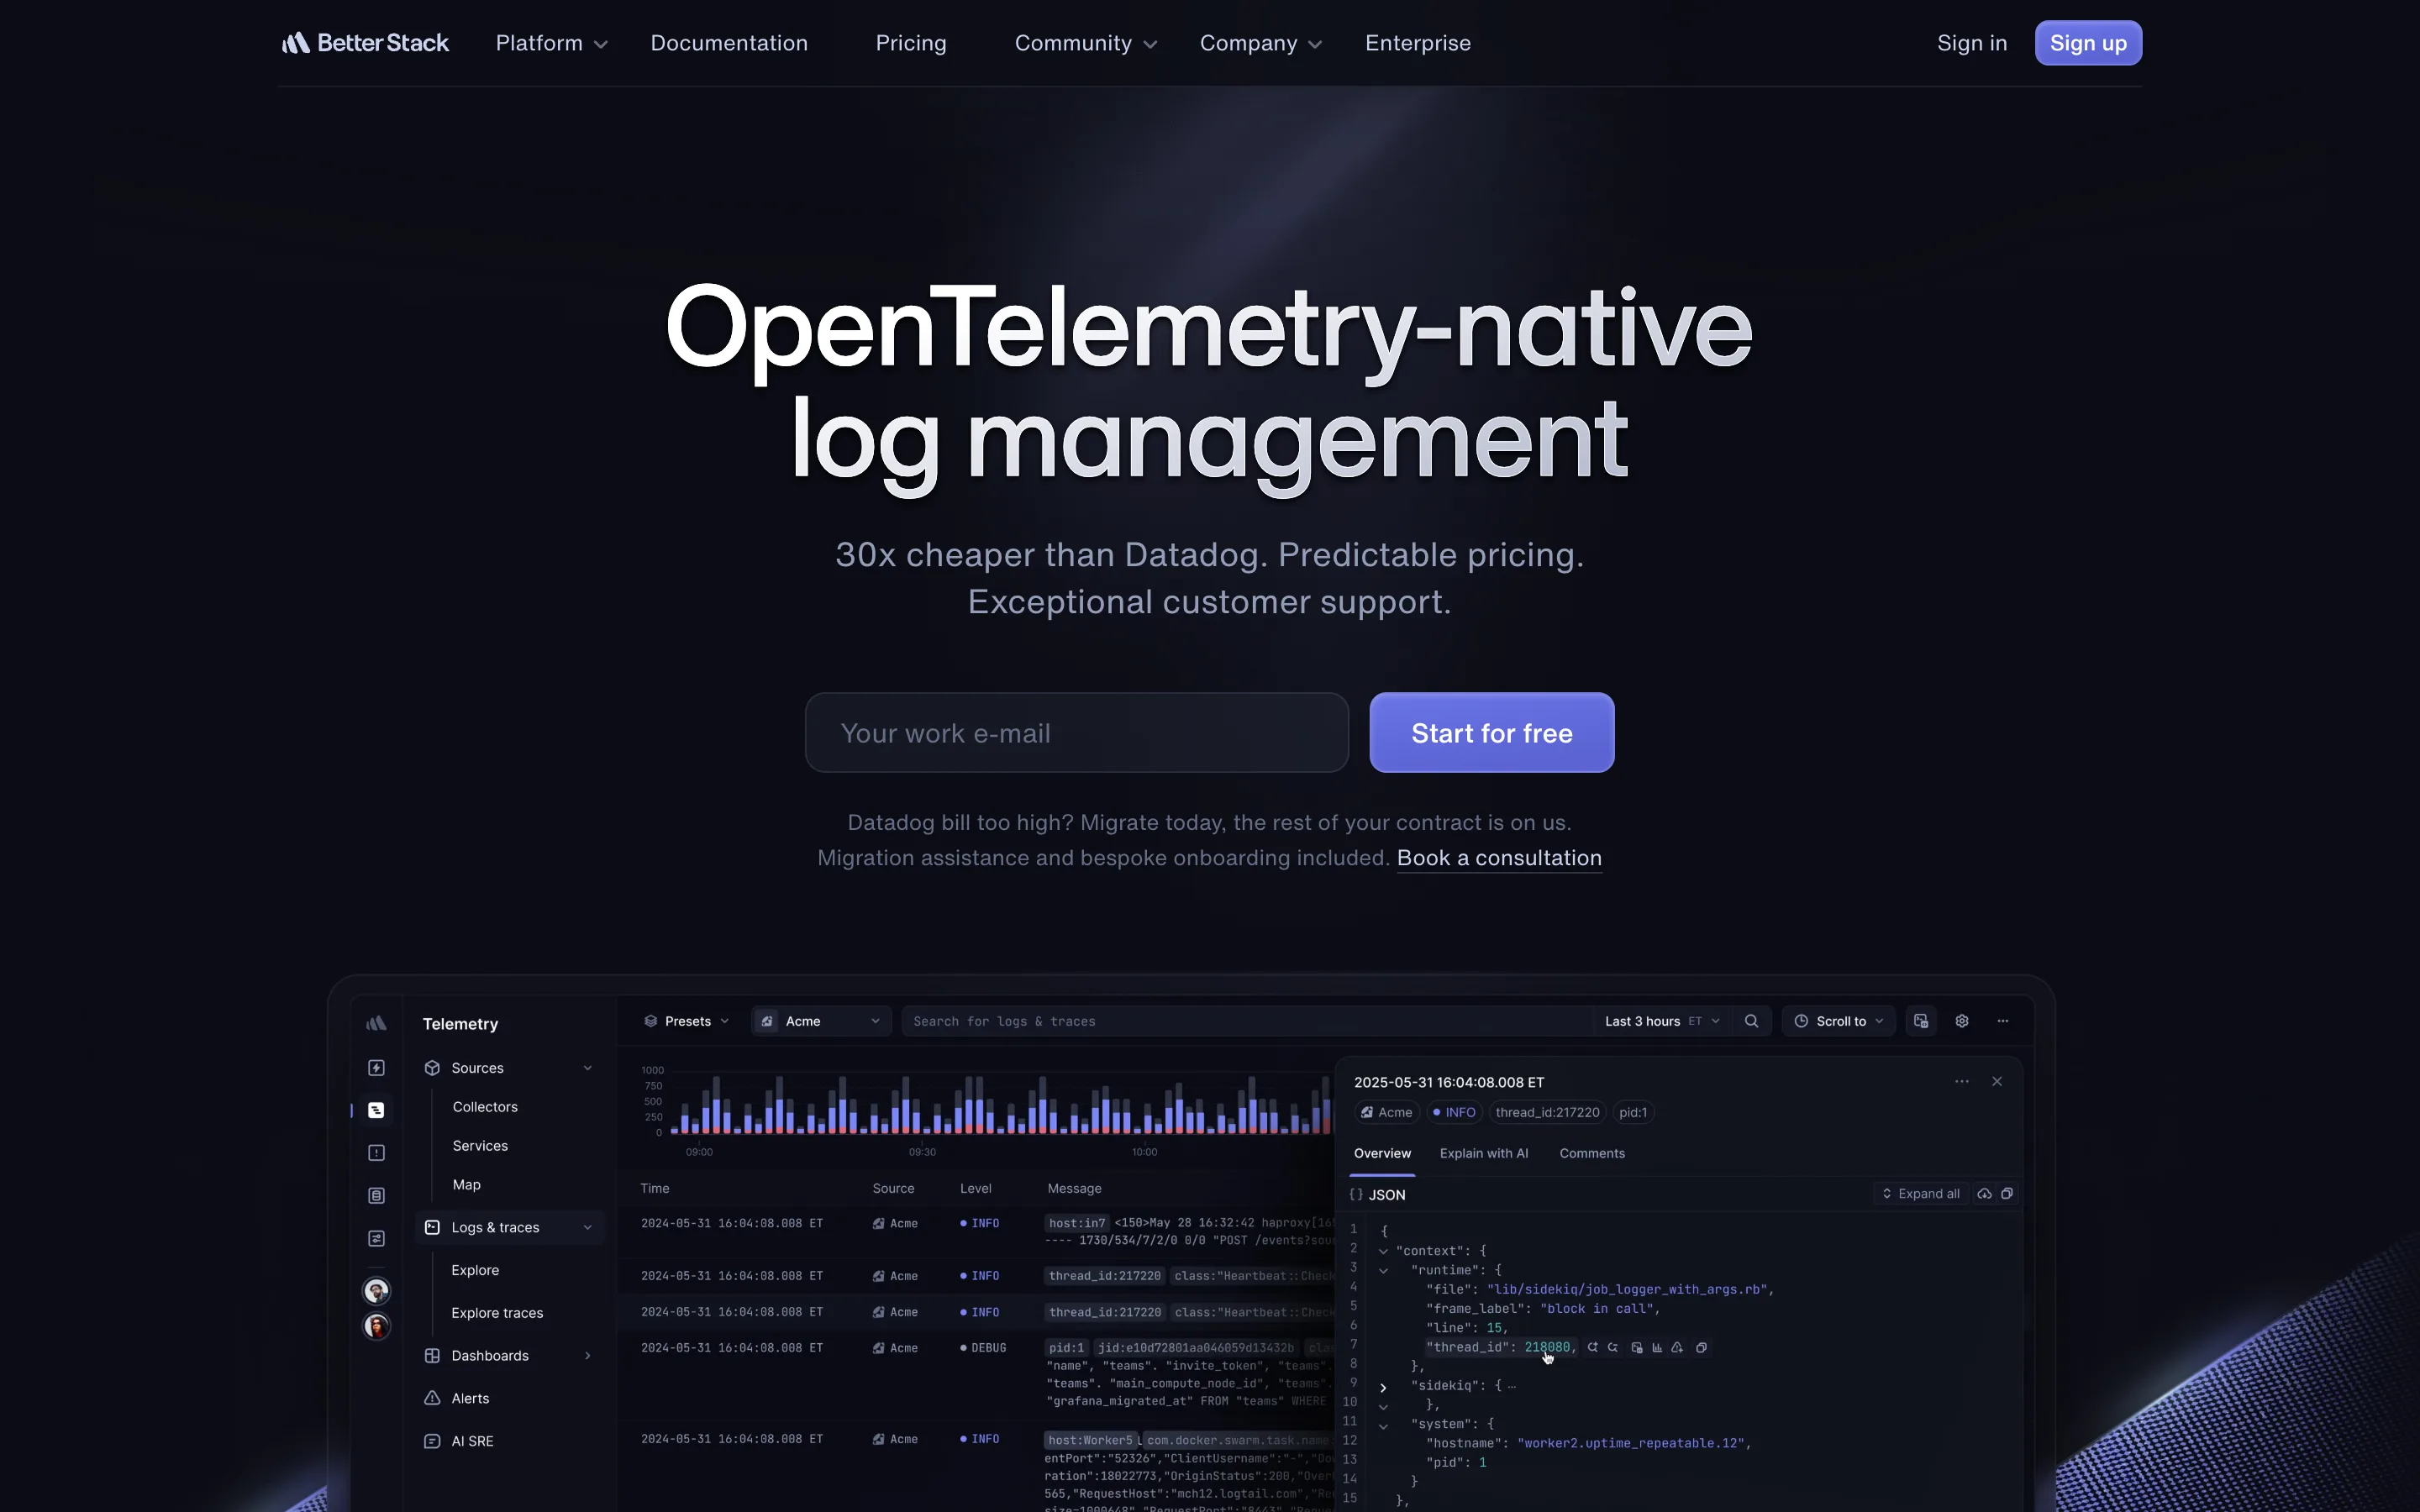
Its 30x cheaper than Datadog claim is plausible at the standard-indexing end, though not verifiable like-for-like. Packaging is the strength: logs, traces, metrics, uptime monitors and incident response arrive together, and the free tier is real, not a trial.
What it does not do is scale down in a log-only shape. Plans bundle three signals at equal volume, so a team shipping 300 GB of logs and almost no metrics pays for metrics anyway.
Pricing: Free 3 GB for 3 days · Micro $350/mo yearly (160 GB each of logs, traces, metrics) · Mega $735 (340 GB) · Tera $1,470 (700 GB) · overage $0.10 to $0.35/GB
Elastic Cloud Serverless
Elastic came out cheapest above because Logs Essentials prices ingestion and retention separately and low.
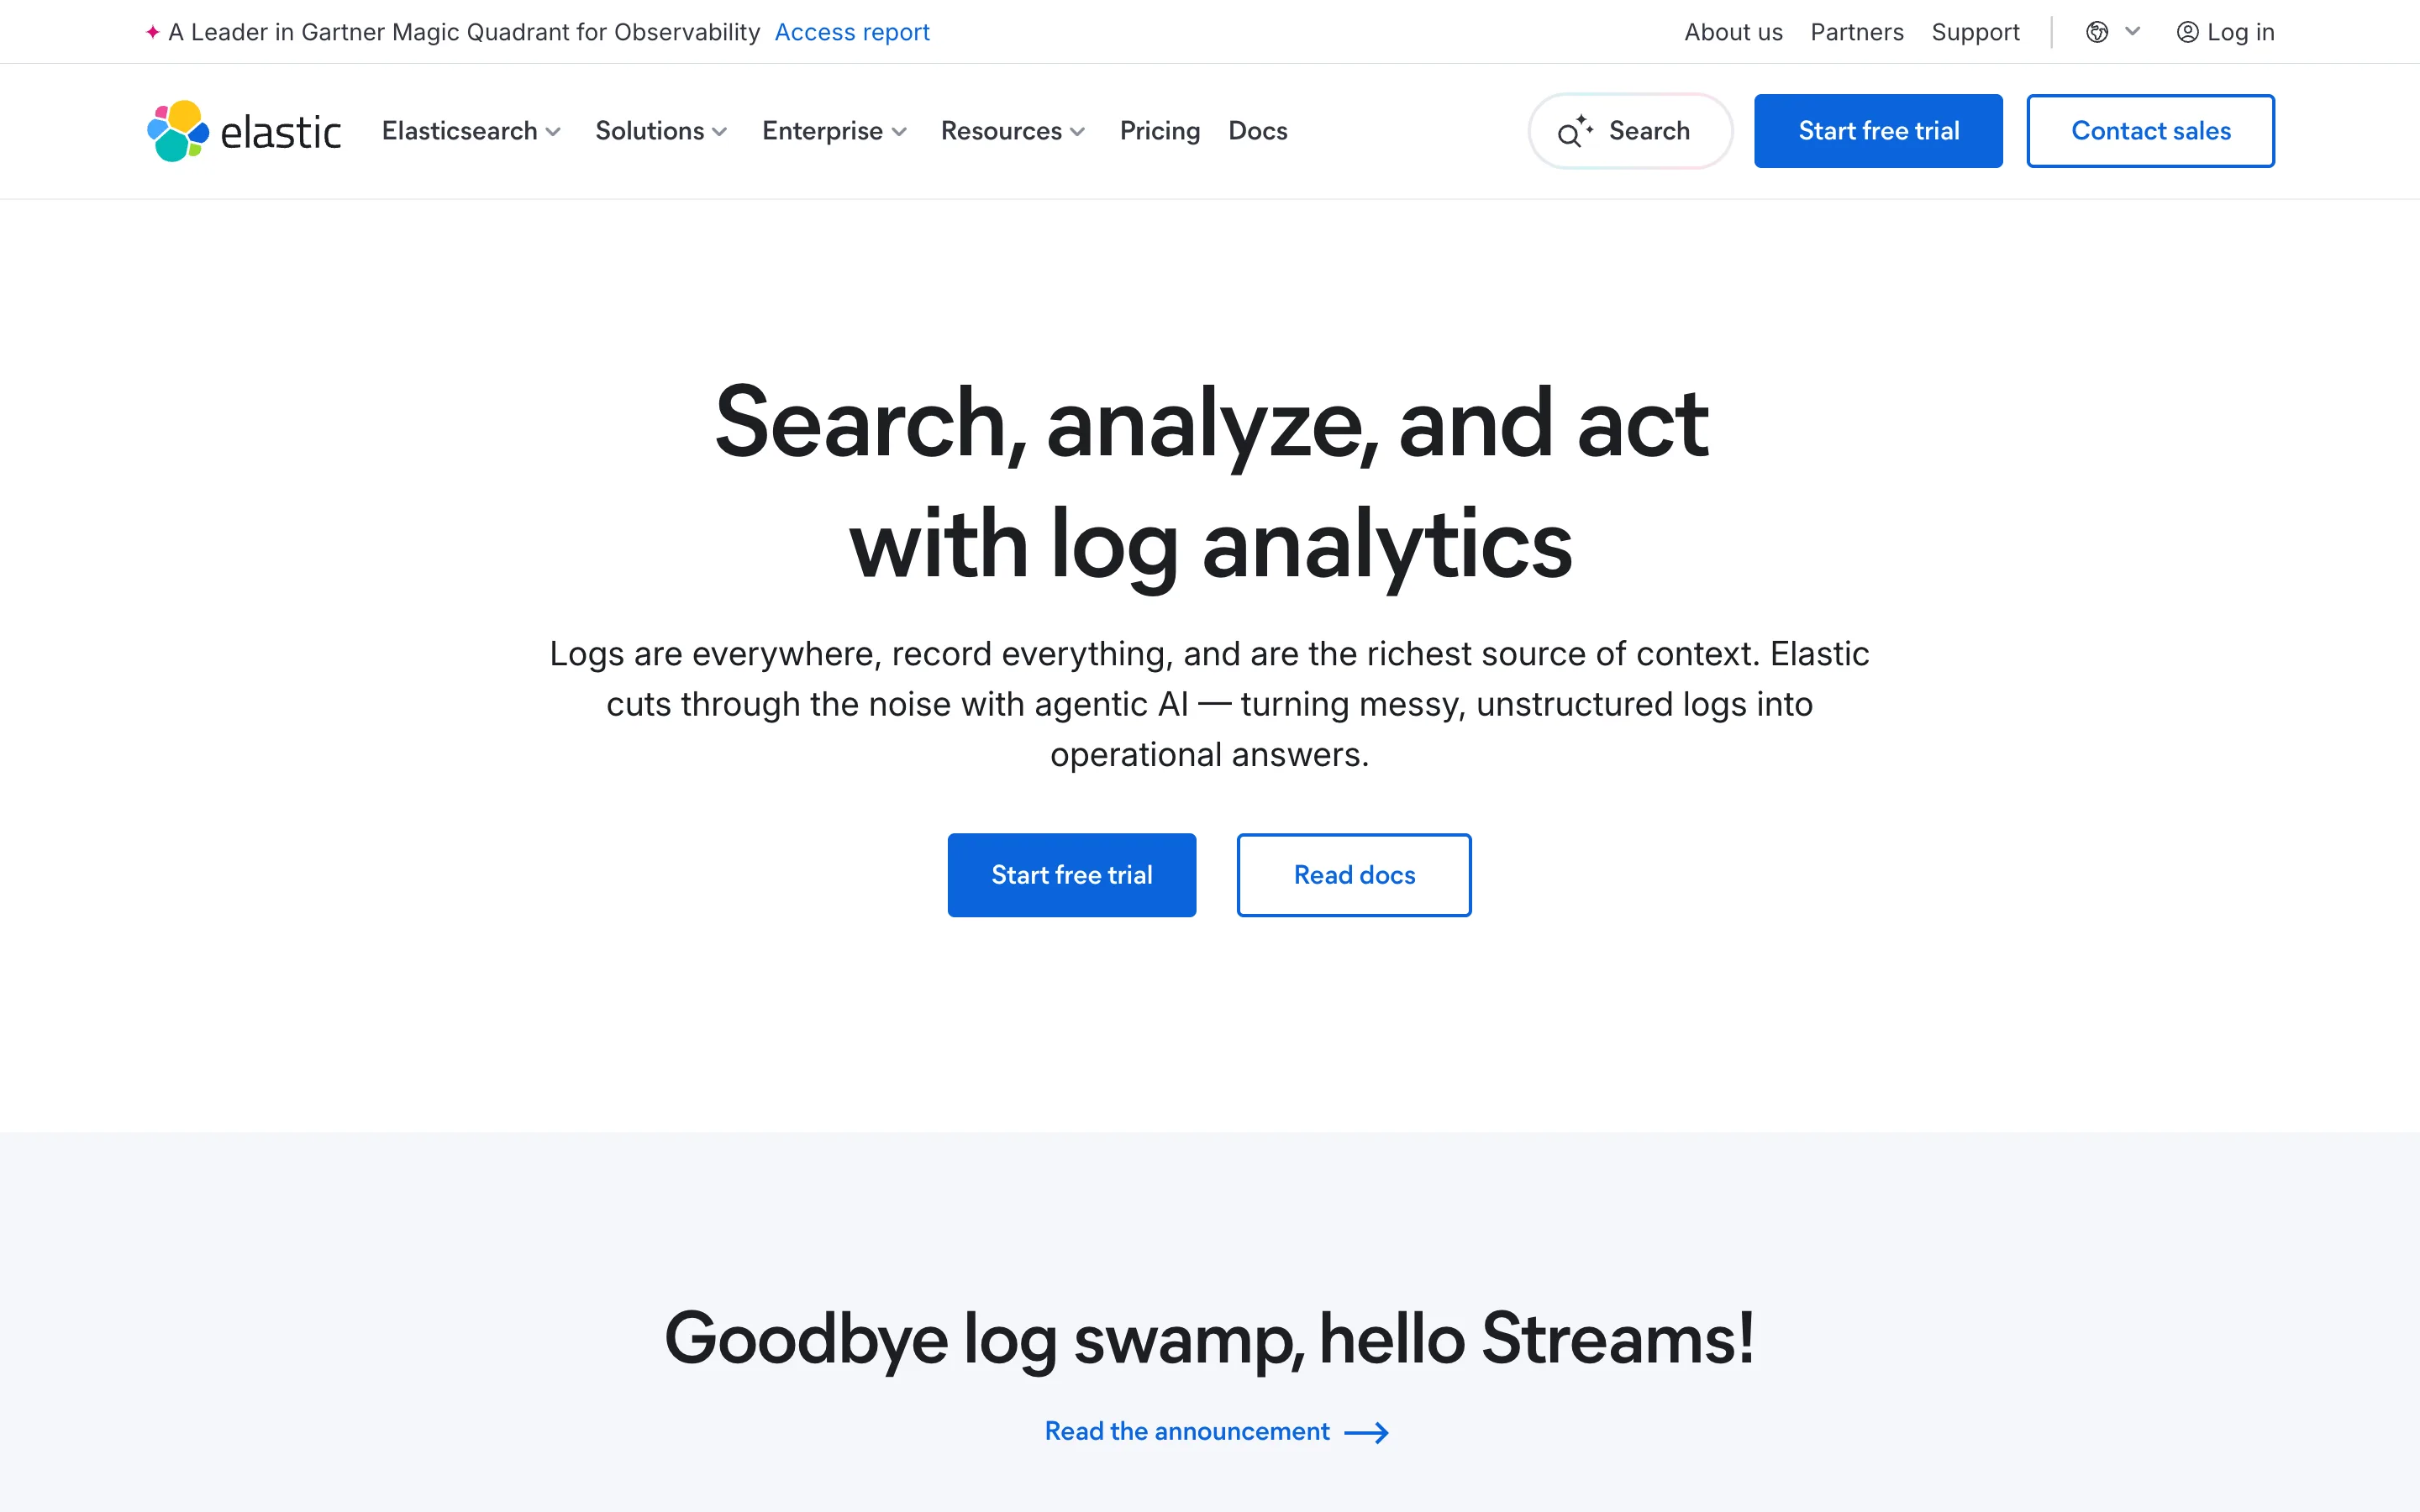
Search is what it does well. This is the lineage that made full-text log search normal, and if your debugging habit is arbitrary substring queries across unstructured logs, nothing here beats it. Serverless also removes the cluster-sizing work.
What it does not do is stay simple above Essentials, where Complete adds ingest at $0.09 and retention at $0.019 plus separate metrics meters. Note also that the $95/month entry price circulating in third-party comparison posts appears nowhere on Elastic's own pricing page.
Pricing: Logs Essentials ingest from $0.07/GB, retention $0.017/GB-month, egress 50 GB free then $0.05/GB · Complete ingest $0.09/GB · no free tier
Grafana Loki
Grafana Loki is the architectural outlier, and its documentation states why plainly: it does not index the contents of the logs, only a set of labels for each log stream.
That decision is why Loki is cheap. Indexing labels instead of content puts the bulk of your data in object storage such as Amazon S3 at object-storage prices. If you already run Prometheus and Grafana, LogQL reads like PromQL's sibling.
What it does not do is arbitrary full-text search at speed. Queries that cannot be narrowed by label end up scanning, and a bad label set produces either unusable cardinality or unusably coarse streams. Grafana publishes per-component sizing guidance, a fair signal that self-hosting at scale is a real commitment.
Pricing: AGPL-3.0, v3.7.8 released September 17, 2026, 25,217 stars · self-host free · Grafana Cloud free 50 GB/month at 14-day retention, Pro $19/mo then Write $0.400, Process $0.050, Retain $0.100/GB
OpenSearch
OpenSearch is the Apache 2.0 path to an Elasticsearch-shaped stack, and for teams whose objection to Elastic is licensing rather than technology it is the obvious destination.
Being unsurprising is the feature. The query DSL, index lifecycle management and dashboards behave the way an ELK veteran expects, and Apache 2.0 removes the question that sent people looking. Version 3.8.0 landed August 5, 2026.
What it does not do is escape the operational weight of an inverted index. Its own install docs require vm.max_map_count of at least 262144, recommend half of system RAM for the Java heap and tell you to disable swapping. That is the price of full-text search over everything.
Pricing: Apache-2.0, 3.8.0 released August 5, 2026 · self-host free · managed pricing varies by cloud provider
Graylog
Graylog is the middle ground: a packaged platform with pipelines, streams, role-based access control and multi-tenancy, built on OpenSearch and MongoDB rather than asking you to assemble them.
It supplies the operations layer raw search engines leave out. Pipeline rules, stream routing, alerting and RBAC are first-class rather than bolt-ons, which is why it appears where who-can-see-which-logs is the hard requirement.
What it does not do is qualify as open source under the OSI definition, and this is worth stating plainly because it is widely misreported. Graylog is released under version 1 of the Server Side Public License, which is not OSI-approved, and GitHub's license detection reports NOASSERTION rather than an SPDX identifier. If your organization permits only OSI-approved licenses, Graylog does not clear it.
Pricing: SSPL v1 (not OSI-approved), 7.1.9 tagged September 2, 2026 · Open edition free to self-host · Enterprise pricing on request
VictoriaLogs
VictoriaLogs is the newest credible entrant, competing on resource efficiency rather than features.
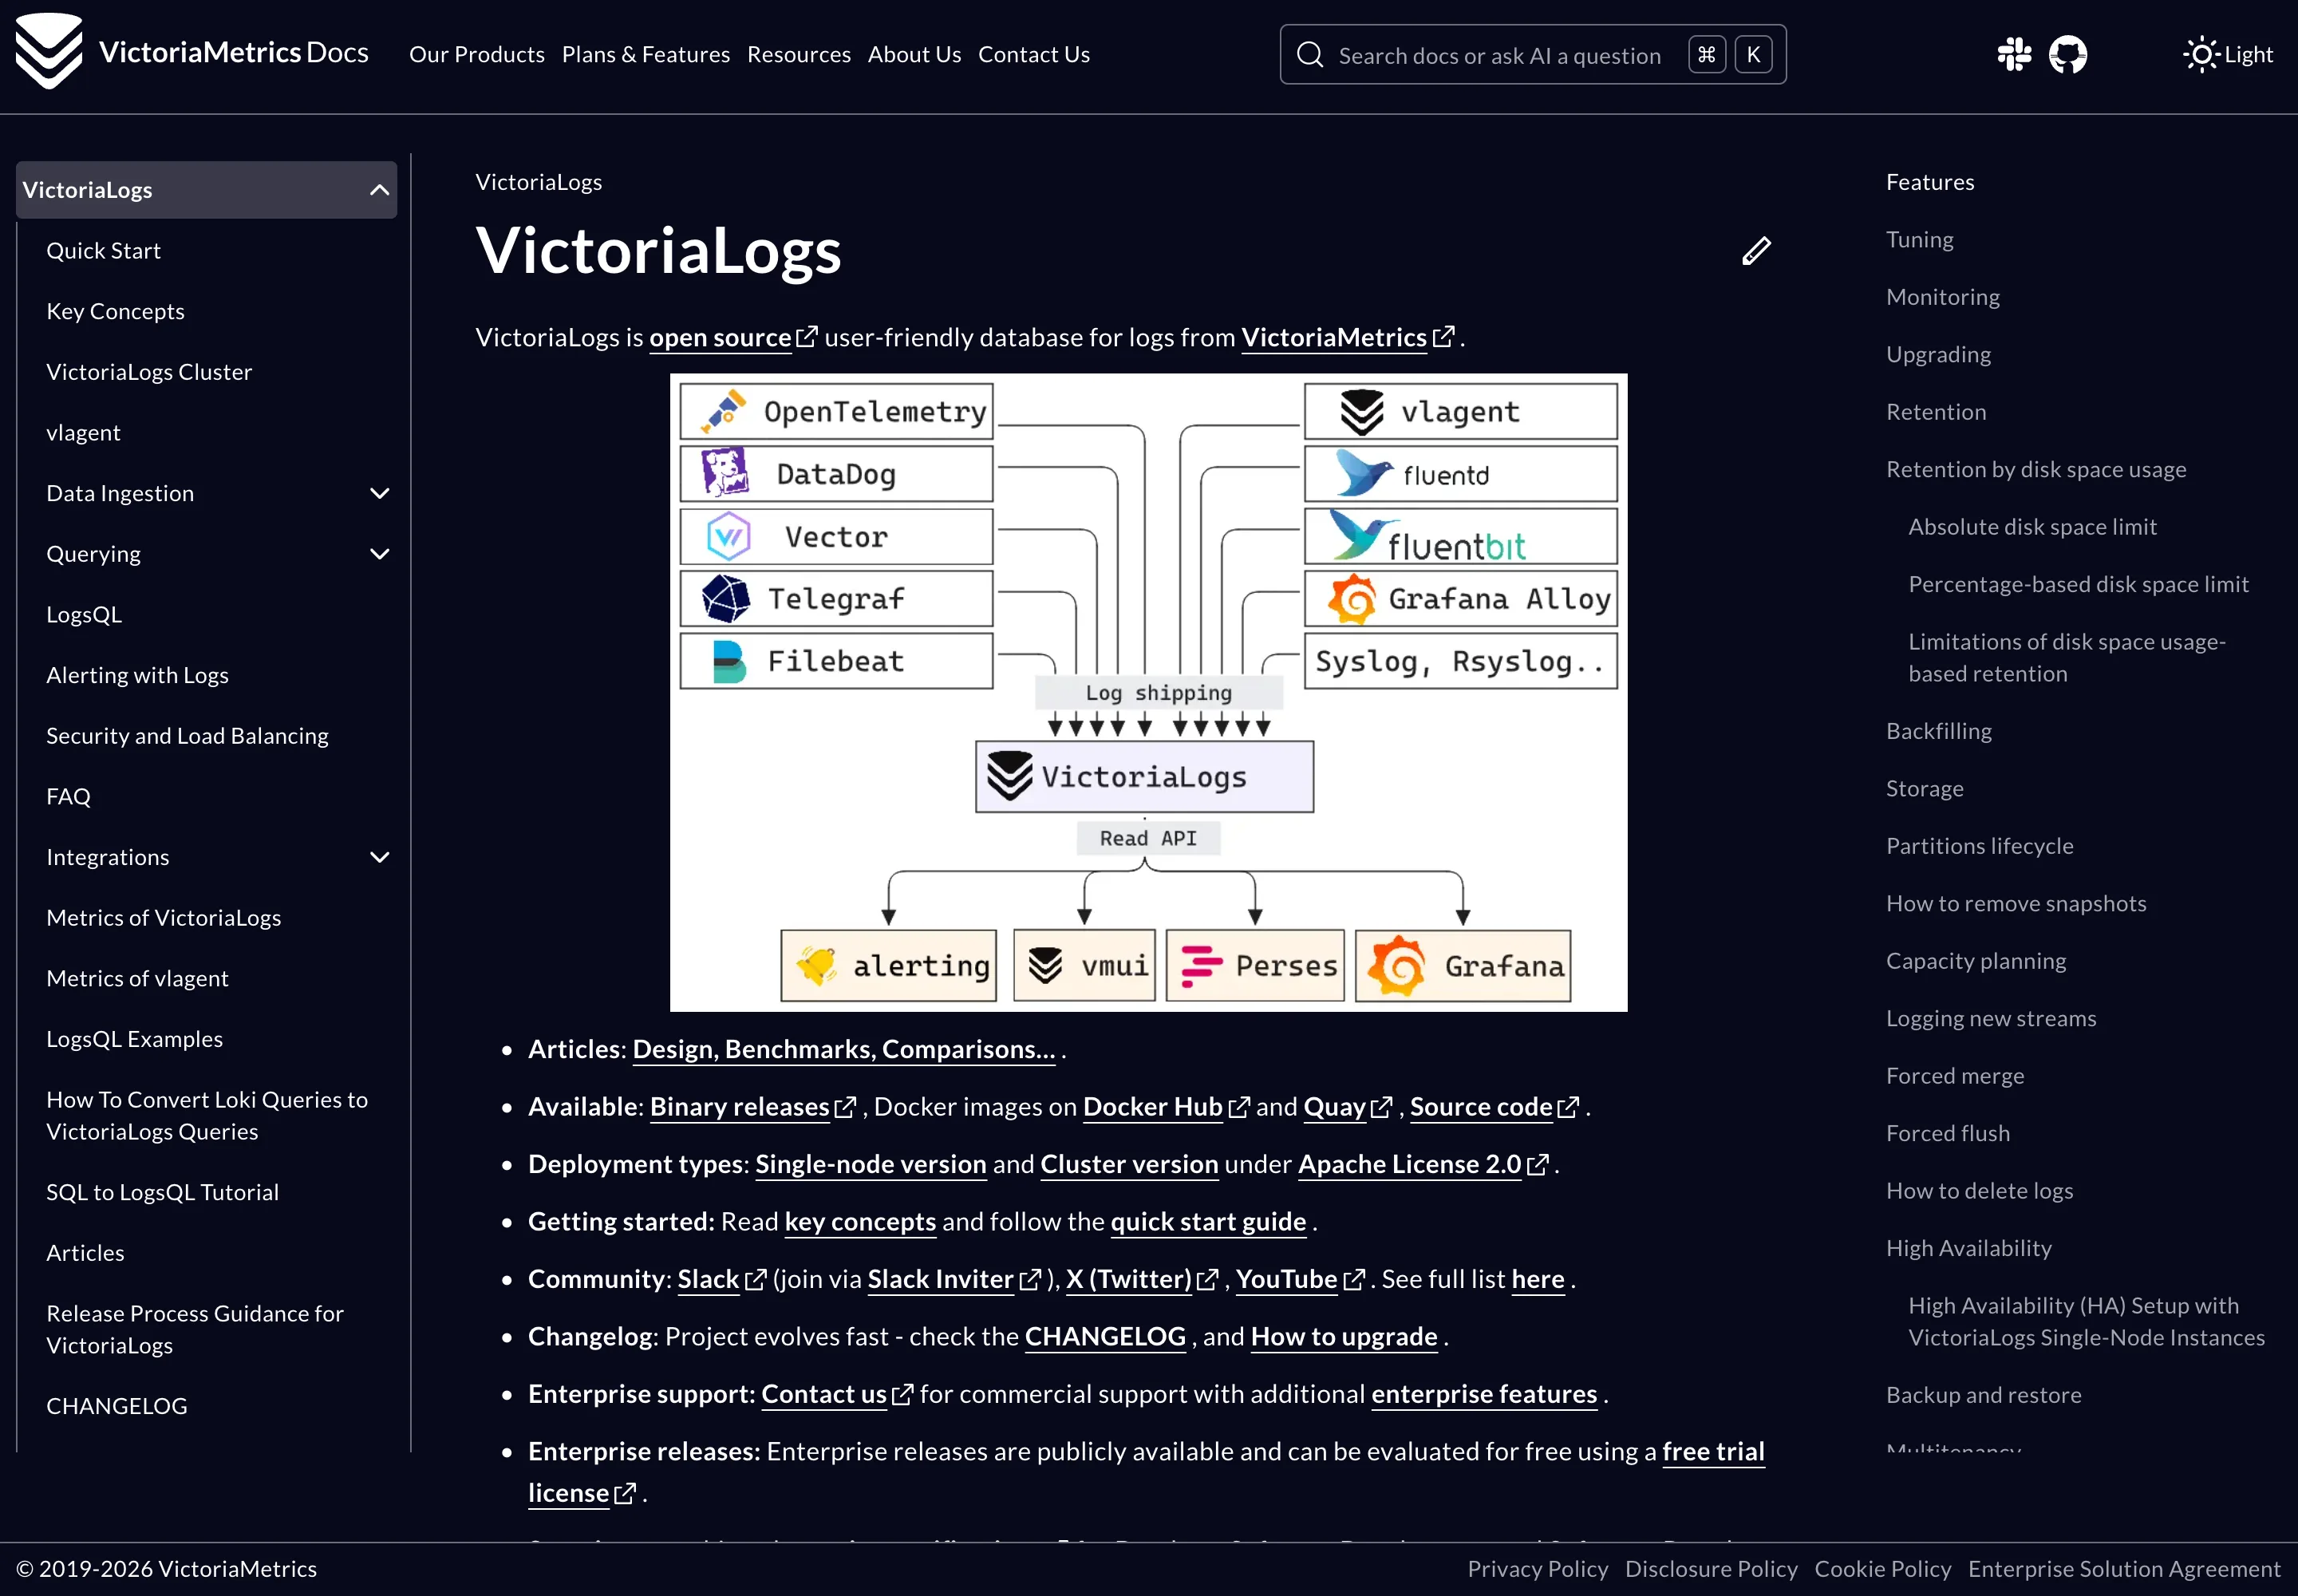
The project claims up to 30x less RAM and up to 15x less disk space than Elasticsearch and Grafana Loki. Treat that as a vendor claim: it is published in VictoriaLogs' own docs with no methodology I could locate, and the comparison targets are named but the workload is not. What is verifiable is the shape: a single zero-config Apache-2.0 executable the docs say runs on a Raspberry Pi and needs no flag tuning.
What it does not do is match the others' ecosystem: no large plugin catalog, far less community troubleshooting material, and a query language your team has not seen.
Pricing: Apache-2.0, v1.52.0 released July 16, 2026 · self-host free · managed cloud available
Side by Side
| Tool | Metering model | Entry price | Self-host | License |
|---|---|---|---|---|
| Datadog Logs | Ingest GB + index per M events | $0.10/GB + $2.50/M events | CloudPrem | Proprietary |
| Better Stack | Bundled plan by volume | Free 3 GB, then $350/mo | No | Proprietary |
| Elastic Serverless | Ingest GB + retained GB-month | $0.07/GB | Yes (self-managed) | Elastic License |
| Grafana Loki | Write + Process + Retain GB | $0 self-host, Cloud free 50 GB | Yes | AGPL-3.0 |
| OpenSearch | Infrastructure only | $0 | Yes | Apache-2.0 |
| Graylog | Infrastructure only | $0 Open edition | Yes | SSPL v1 |
| VictoriaLogs | Infrastructure only | $0 | Yes | Apache-2.0 |
How to Choose Without Migrating Twice
- Measure your real average log line size. Pipe a day of production logs through
wc -cand divide by the line count. Every per-event price here moves inversely with that number. - Separate the logs you search from the logs you keep. What fraction do you actually query during an incident? If it is under a fifth, an ingest-cheap and index-selective model wins, and that ratio decides more of your bill than the vendor does.
- Test the query you actually run at 2am, not a benchmark query. If your habit is grepping unstructured stack traces for a substring, Loki's label model will fight you whatever its pricing looks like.
- Check the license against your policy before the trial. Graylog's SSPL and Elastic's license are not OSI-approved, and Loki's AGPL-3.0 blocks some legal teams.
- Ship through OpenTelemetry regardless of who wins. A collector in front of your backend turns the next migration into a config change.
Which One Should You Actually Use?
Already deep in Datadog for APM: Stay, but move everything you do not query into Flex Logs. That alone takes 500 GB from $1,360.72 to $364.57 a month.
Kubernetes shop running Prometheus and Grafana: Loki, self-hosted if you have platform capacity, Grafana Cloud if not. The free 50 GB tier covers a small cluster outright.
You need full-text search over unstructured logs: OpenSearch self-hosted if you have the operations budget, Elastic Cloud Serverless if you would rather pay $0.07 per GB and skip cluster tuning.
Small team that wants one bill and no platform work: Better Stack. One number to defend rather than four meters to model.
Regulated environment where access control is the requirement: Graylog, provided SSPL clears legal review. If it does not and the hardware is small, VictoriaLogs is the Apache-2.0 fallback.
Conclusion
The change this year is not that log tools got cheaper. It is that the cost of full-text indexing became explicit enough to shop around, with Datadog's Flex tier, Elastic's serverless retention pricing and Loki's label-only index all selling the same idea: stop indexing what you will never search.
Before renewing, answer one question with data. What percentage of the logs you paid to index last quarter did you actually query? If nobody can answer, that number is your negotiating position.
Related DevToolLab Tools
- Grok Pattern Tester - build the Grok patterns that turn unstructured lines into the fields every backend here bills you to index.
- Logfmt Parser - decode the logfmt format Loki pipelines emit, without pasting production lines into a third-party site.
- Syslog Parser - decode RFC 5424 and RFC 3164 when a shipper drops fields and you need to see what the wire carried.
- OTel Config Generator - generate the Collector YAML that makes step 5 possible.
Related Guides
- 7 Datadog Alternatives and What They Cost - the full-platform view, covering metrics and APM rather than log meters.
- Best Uptime Monitoring Tools in 2026 - the availability side, where the signal is a probe.
- Best Sentry Alternatives in 2026 - error tracking, which overlaps logs but is priced per event.
- OpenTelemetry Node.js Setup Guide - step 5 in practice, with working instrumentation code.