
Every uptime monitor answers the same question, which is whether the thing is up, so the differences that matter are all in the fine print: how often it checks, how many endpoints it watches before it starts billing, and whether it can wake someone at 3 AM. Those three numbers move independently, and the free tiers are where they diverge hardest.
Reading the four hosted vendors' own pricing pages on September 17, 2026 and running the arithmetic produced one result worth leading with: the cheapest way to watch 10 endpoints with a mean detection time under 60 seconds is a free plan, not a paid one. Checkly's Hobby tier does it at $0. UptimeRobot's free tier gives you five times as many monitors, but checks a fifth as often, so it cannot.
What Each Plan Actually Costs
| Tool | Free tier | Free check interval | Entry paid plan | Fastest interval |
|---|---|---|---|---|
| UptimeRobot | 50 monitors | 5 minutes | $9/mo, 10 monitors | 15 seconds (Scale) |
| Better Stack | 10 monitors, 10 heartbeats | 3 minutes | $25/mo per extra 50 monitors | 30 seconds |
| Checkly | 10 monitors | 2 minutes | $24/mo, 50 monitors | 30 seconds (Team) |
| Cronitor | 5 monitors | 5 minutes | $2/mo per monitor | 30 seconds |
| Uptime Kuma | unlimited, self-hosted | configurable | none, MIT licensed | configurable |
| Gatus | unlimited, self-hosted | configurable | hosted plan available | configurable |
| Upptime | unlimited, on GitHub Actions | 5 minutes | none, MIT licensed | 5 minutes |
How to Work Out What You Need
A failure lands at a random point between two checks, so the average wait before your monitor even looks is half the check interval. That is the detection floor, before alert delivery adds its own delay. This script applies that to the plan data above.
js// uptime-cost.mjs - Node 18+, no dependencies. Run: node uptime-cost.mjs // Plan data read from each vendor's own pricing page on September 17, 2026. const PLANS = [ ["UptimeRobot Free", 0, 50, 300], ["UptimeRobot Solo", 9, 10, 60], ["UptimeRobot Team", 35, 100, 30], ["UptimeRobot Scale", 65, 200, 15], ["Better Stack Free", 0, 10, 180], ["Checkly Hobby", 0, 10, 120], ["Checkly Starter", 24, 50, 60], ["Checkly Team", 64, 75, 30], ["Cronitor Hacker", 0, 5, 300], ] const NEED = 10 // how many monitors you actually have const TARGET_DETECT = 60 // acceptable mean seconds to detection const rows = PLANS.map(([name, usd, monitors, interval]) => ({ name, usd, monitors, interval, meanDetect: interval / 2, perMonitor: usd === 0 ? 0 : usd / monitors, fits: monitors >= NEED, })) for (const r of rows) { console.log( r.name.padEnd(20) + String(r.usd).padStart(6) + String(r.monitors).padStart(10) + `${r.interval}s`.padStart(10) + `${r.meanDetect}s`.padStart(13) + (r.usd === 0 ? "free" : `$${r.perMonitor.toFixed(2)}`).padStart(11) + (r.fits ? " yes" : " no"), ) } const ok = rows.filter((r) => r.fits && r.meanDetect <= TARGET_DETECT).sort((a, b) => a.usd - b.usd) console.log(`\ncheapest plan covering ${NEED} monitors under ${TARGET_DETECT}s:`) console.log(ok.length ? ` ${ok[0].name} at $${ok[0].usd}/mo` : " nothing here qualifies")
Run on September 17, 2026:
textplan $/mo monitors interval mean detect $/monitor fits -------------------------------------------------------------------------------- UptimeRobot Free 0 50 300s 150s free yes UptimeRobot Solo 9 10 60s 30s $0.90 yes UptimeRobot Team 35 100 30s 15s $0.35 yes UptimeRobot Scale 65 200 15s 7.5s $0.33 yes Better Stack Free 0 10 180s 90s free yes Checkly Hobby 0 10 120s 60s free yes Checkly Starter 24 50 60s 30s $0.48 yes Checkly Team 64 75 30s 15s $0.85 yes Cronitor Hacker 0 5 300s 150s free no cheapest plan covering 10 monitors under 60s: Checkly Hobby at $0/mo
The per-monitor column is the one that reorders the market. UptimeRobot Scale costs $65 a month and works out at $0.33 per monitor, the cheapest paid slot in the table, while Checkly Team at $64 lands at $0.85 because it includes 75 monitors rather than 200. Buying on headline price gets this backwards.
The Hosted Options
UptimeRobot
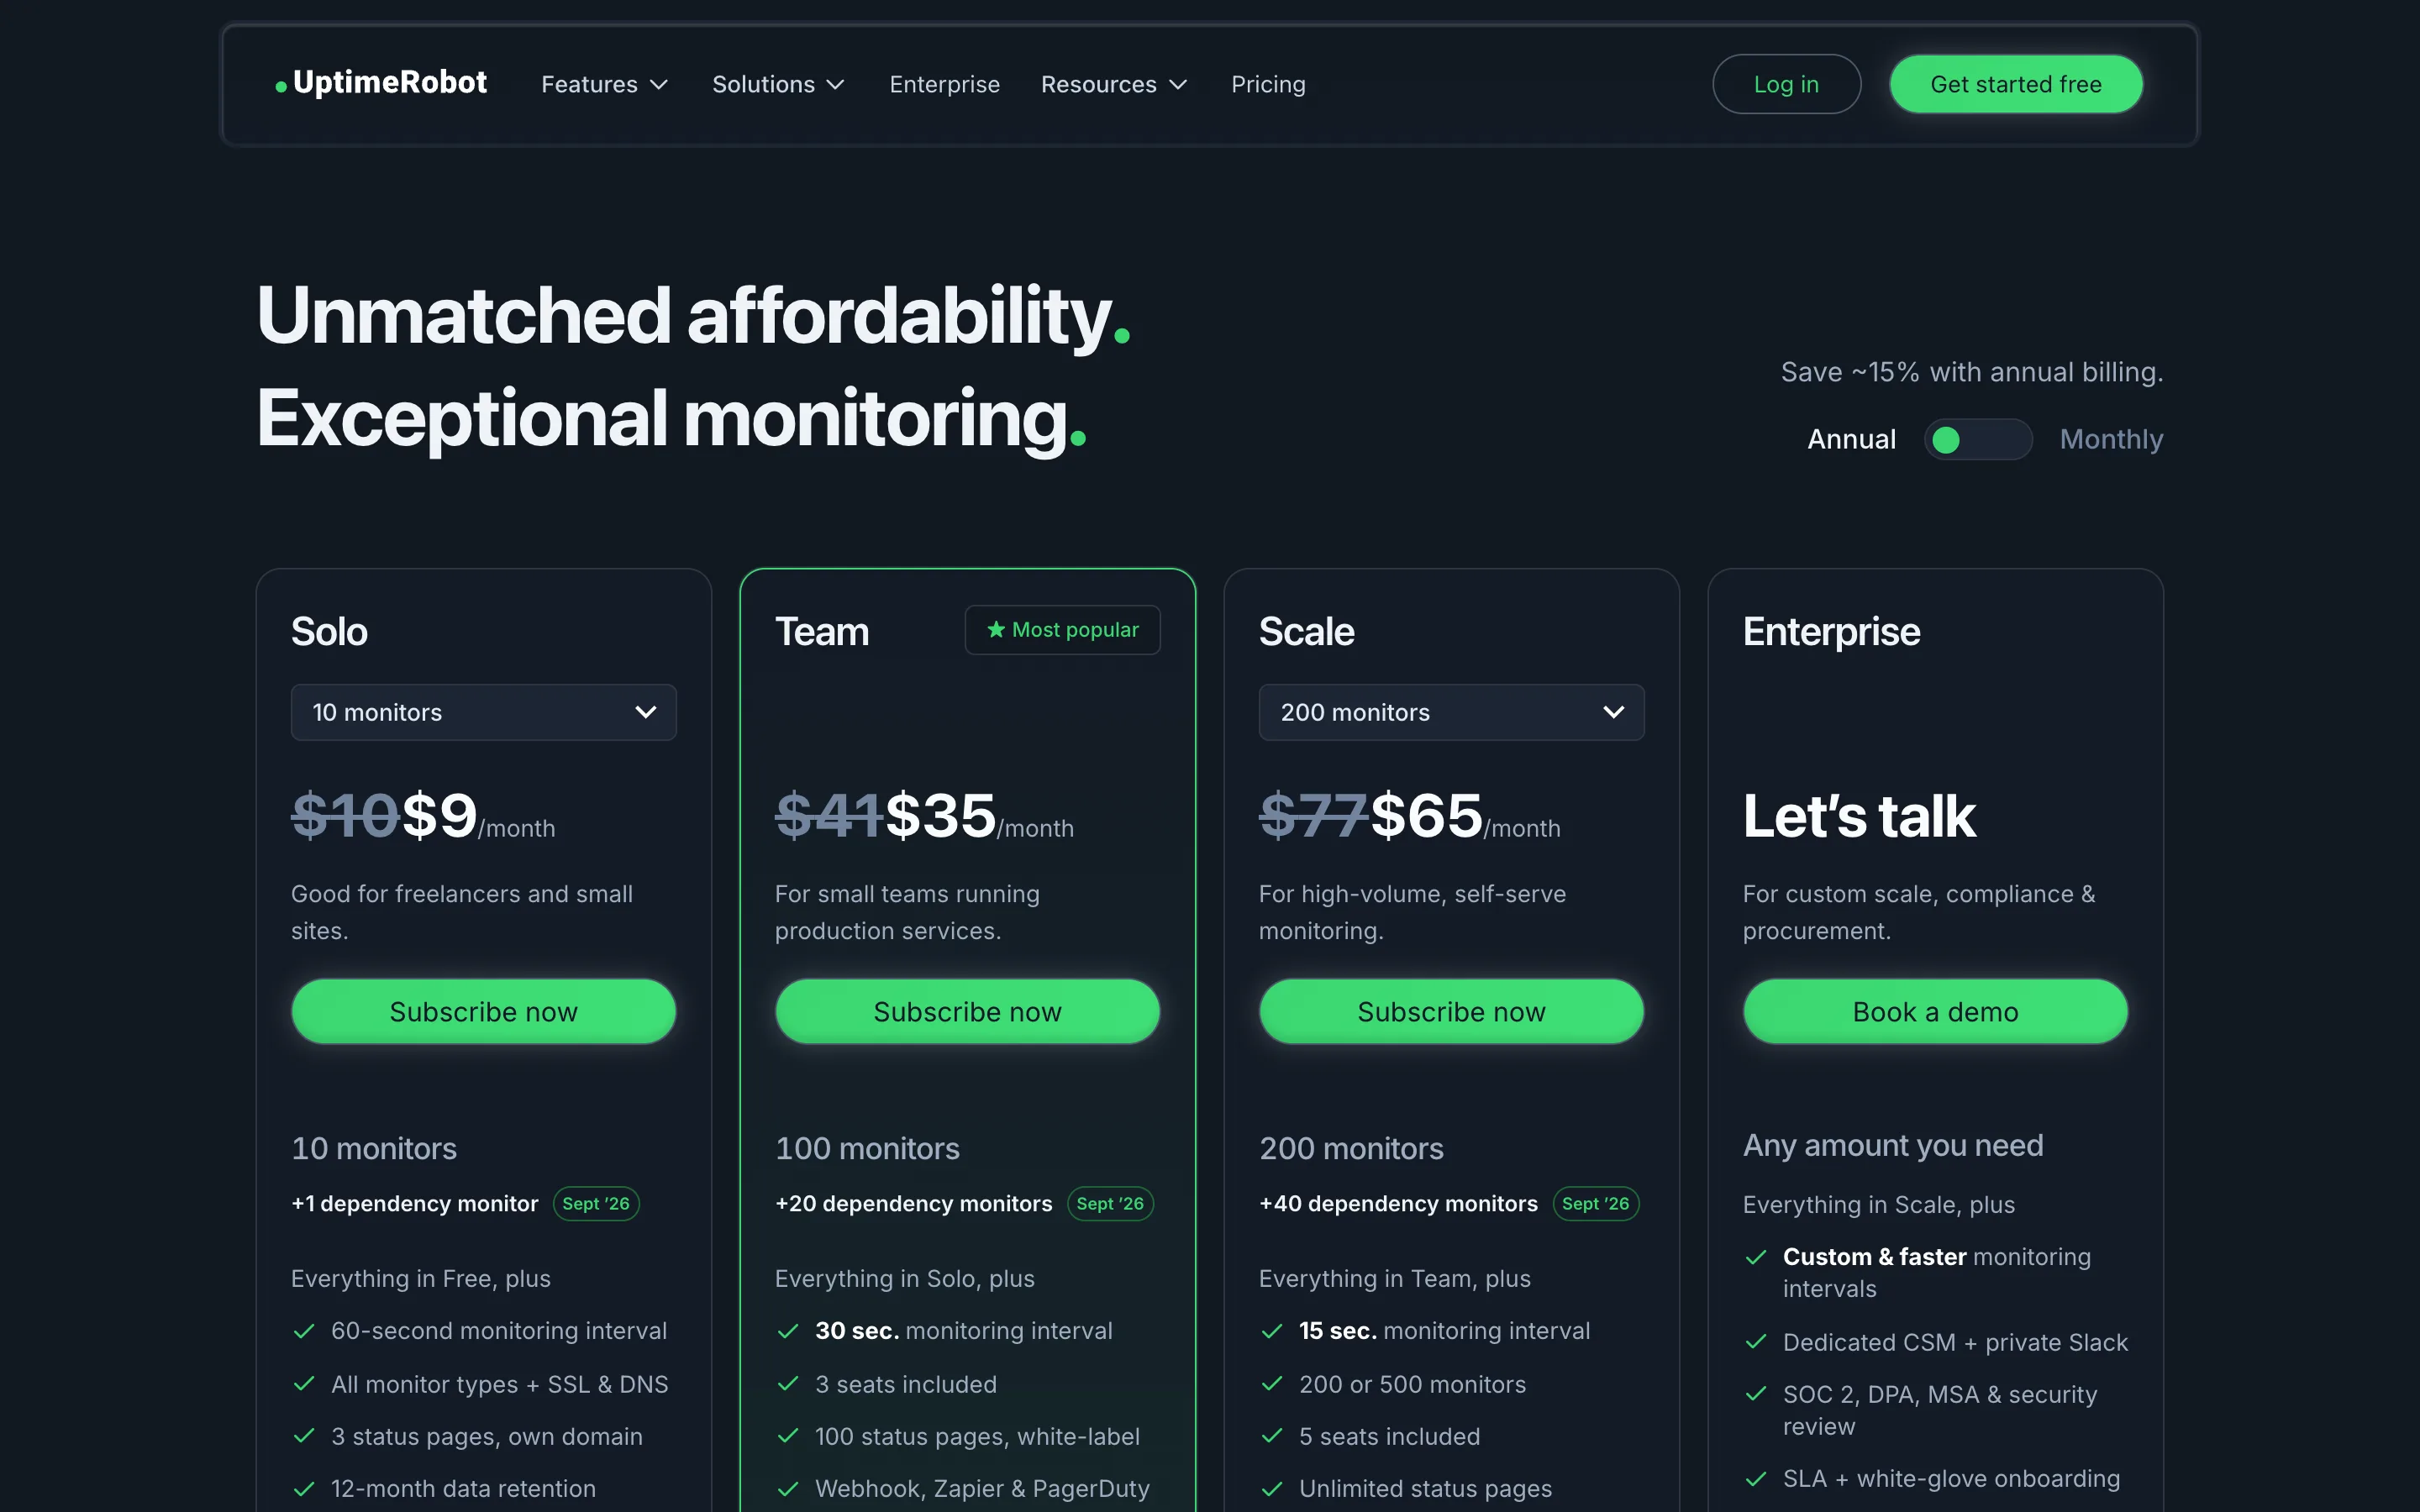
UptimeRobot has the most generous free tier in this comparison: 50 monitors at a 5-minute interval with no credit card, covering HTTP, port and ping checks. Paid plans as of September 17, 2026 run $9 per month for Solo with 60-second checks, $35 for Team with 30-second checks and 100 monitors, and $65 for Scale with 15-second checks and 200 monitors, all at annual billing. The 15-second interval on Scale is the fastest entry-level figure here.
The catch is that the free tier's 5-minute interval means an average of 150 seconds before a failure is even noticed. For a marketing site that is fine. For a checkout flow it is not.
Better Stack
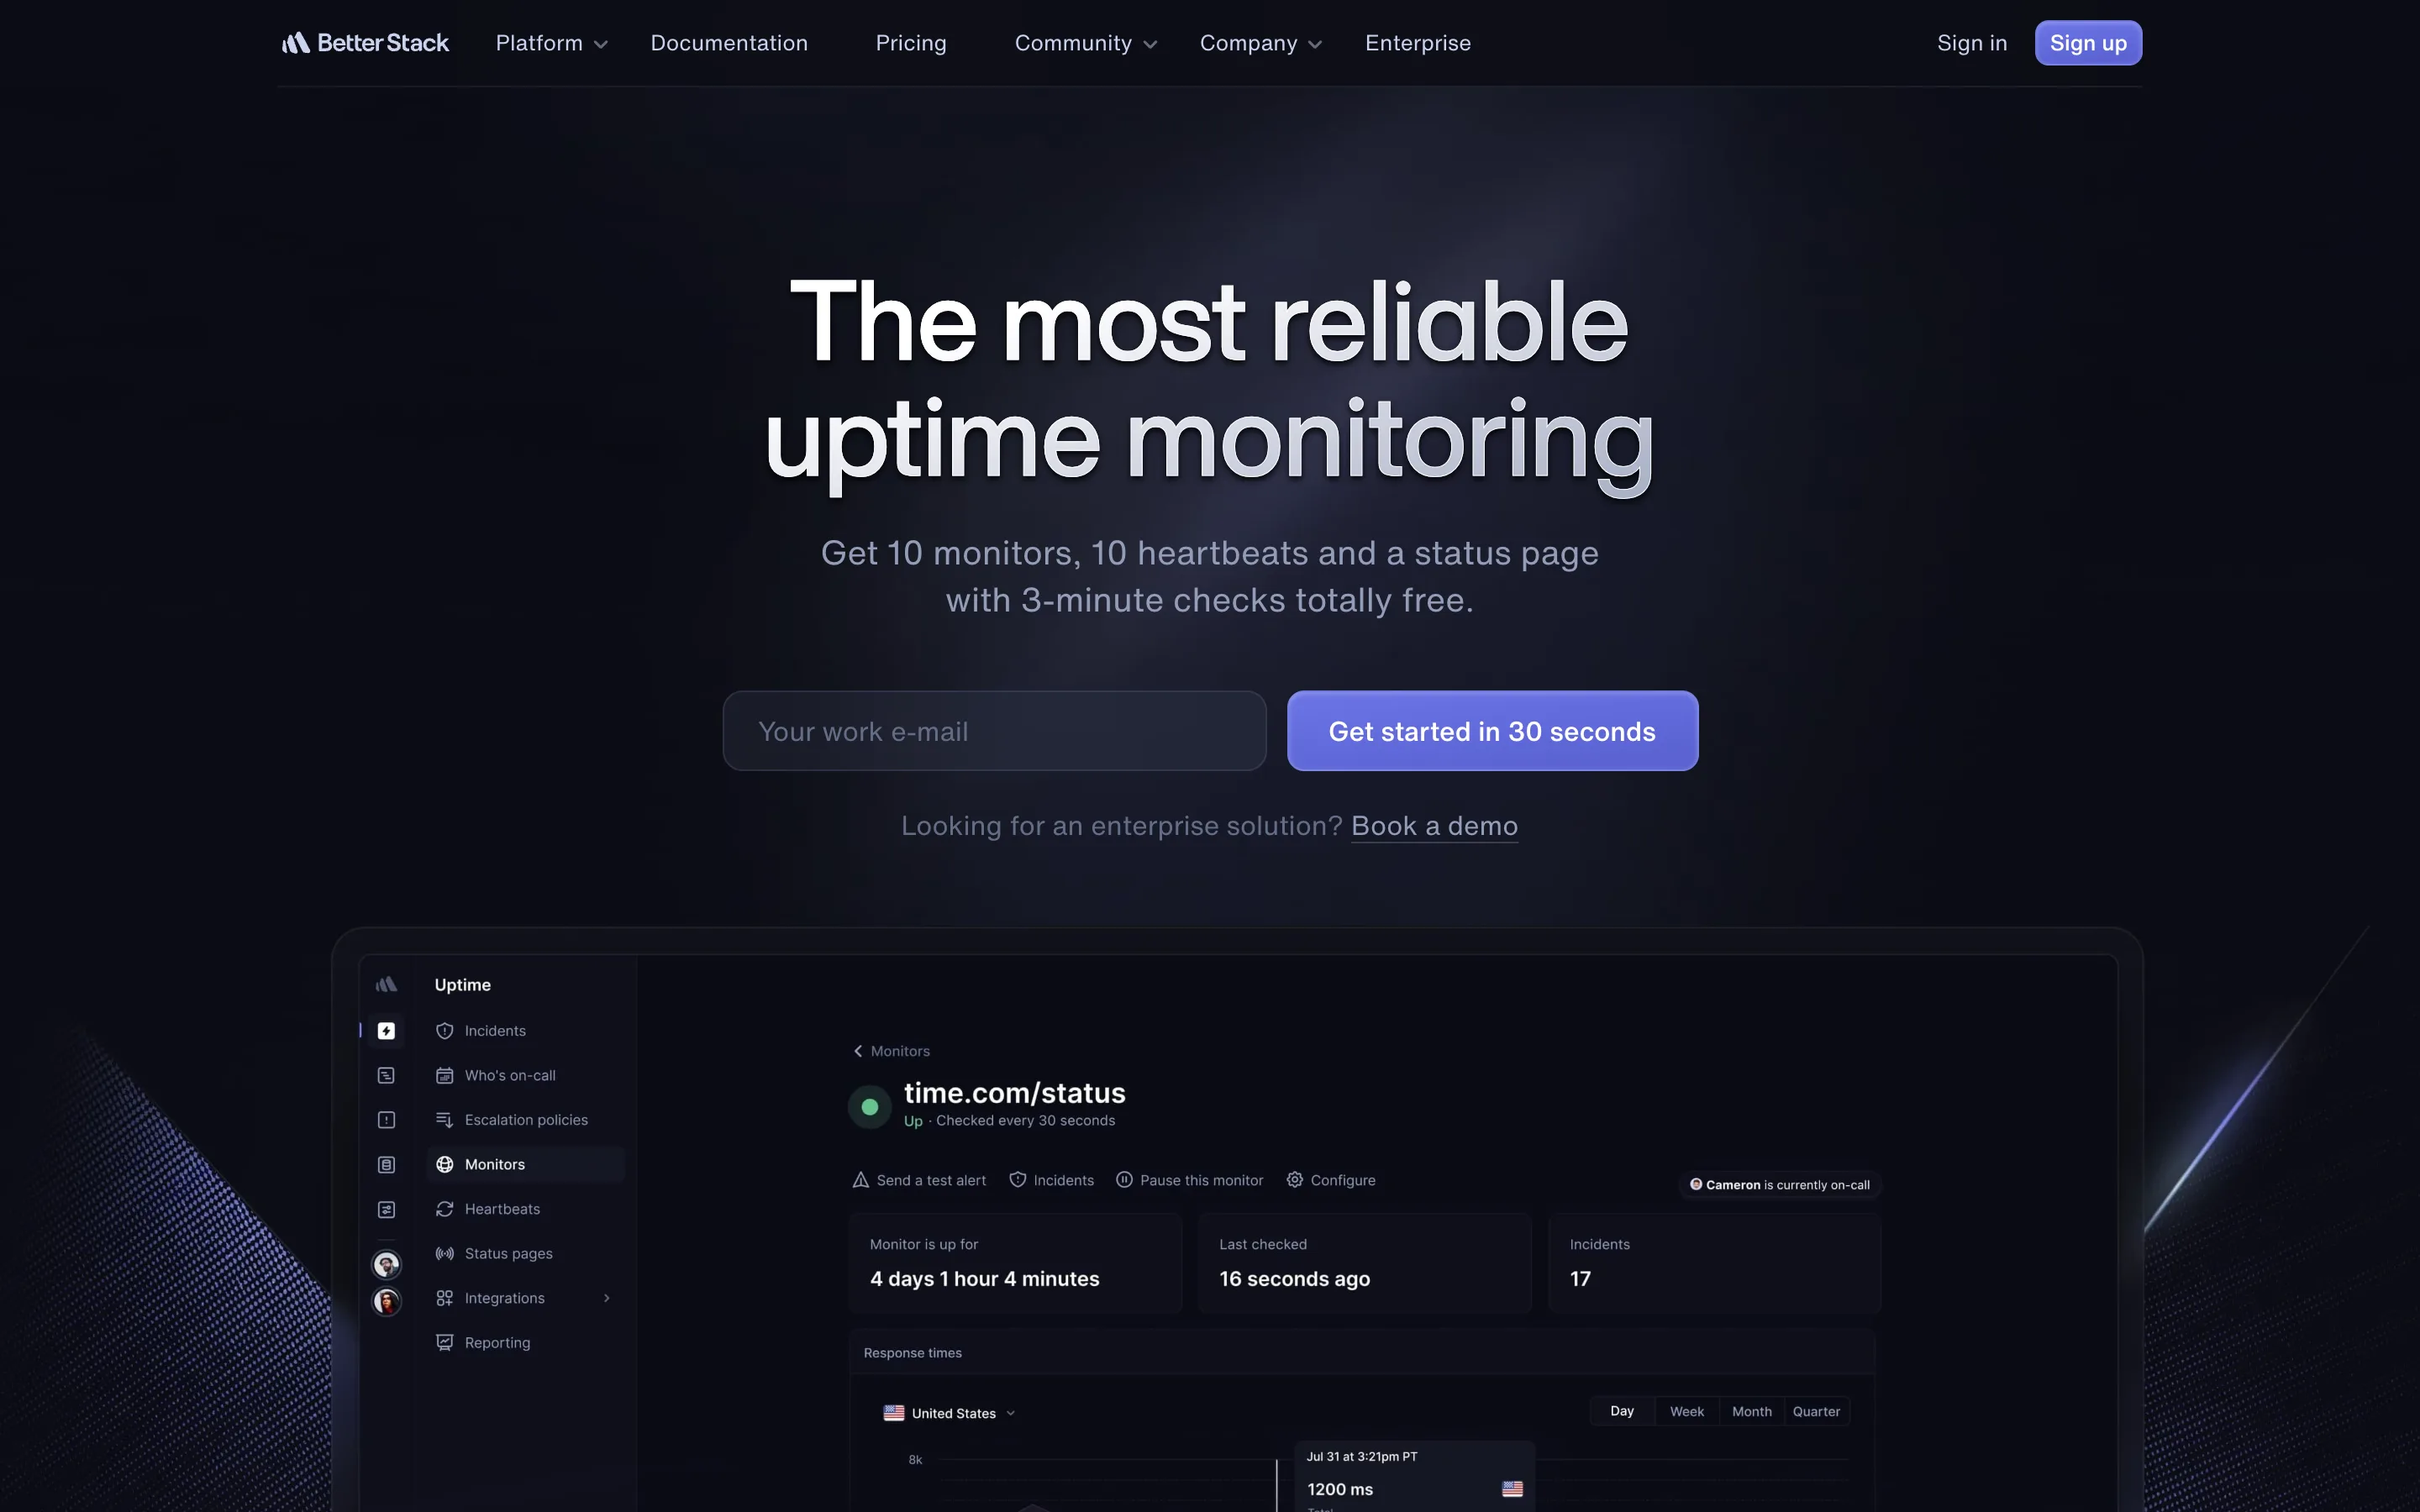
Better Stack bundles uptime monitoring with incident management, on-call scheduling and status pages in one product, which is the real reason to pick it. Its own uptime page advertises 10 monitors, 10 heartbeats and a status page with 3-minute checks at no cost. Beyond that the pricing is modular: an additional 50 monitors costs $25 per month, or $21 billed yearly, and an additional 10 heartbeats costs $20 per month, or $17 yearly.
If you would otherwise buy uptime monitoring and an on-call tool separately, the bundled price is the comparison to run, not the per-monitor rate.
Checkly
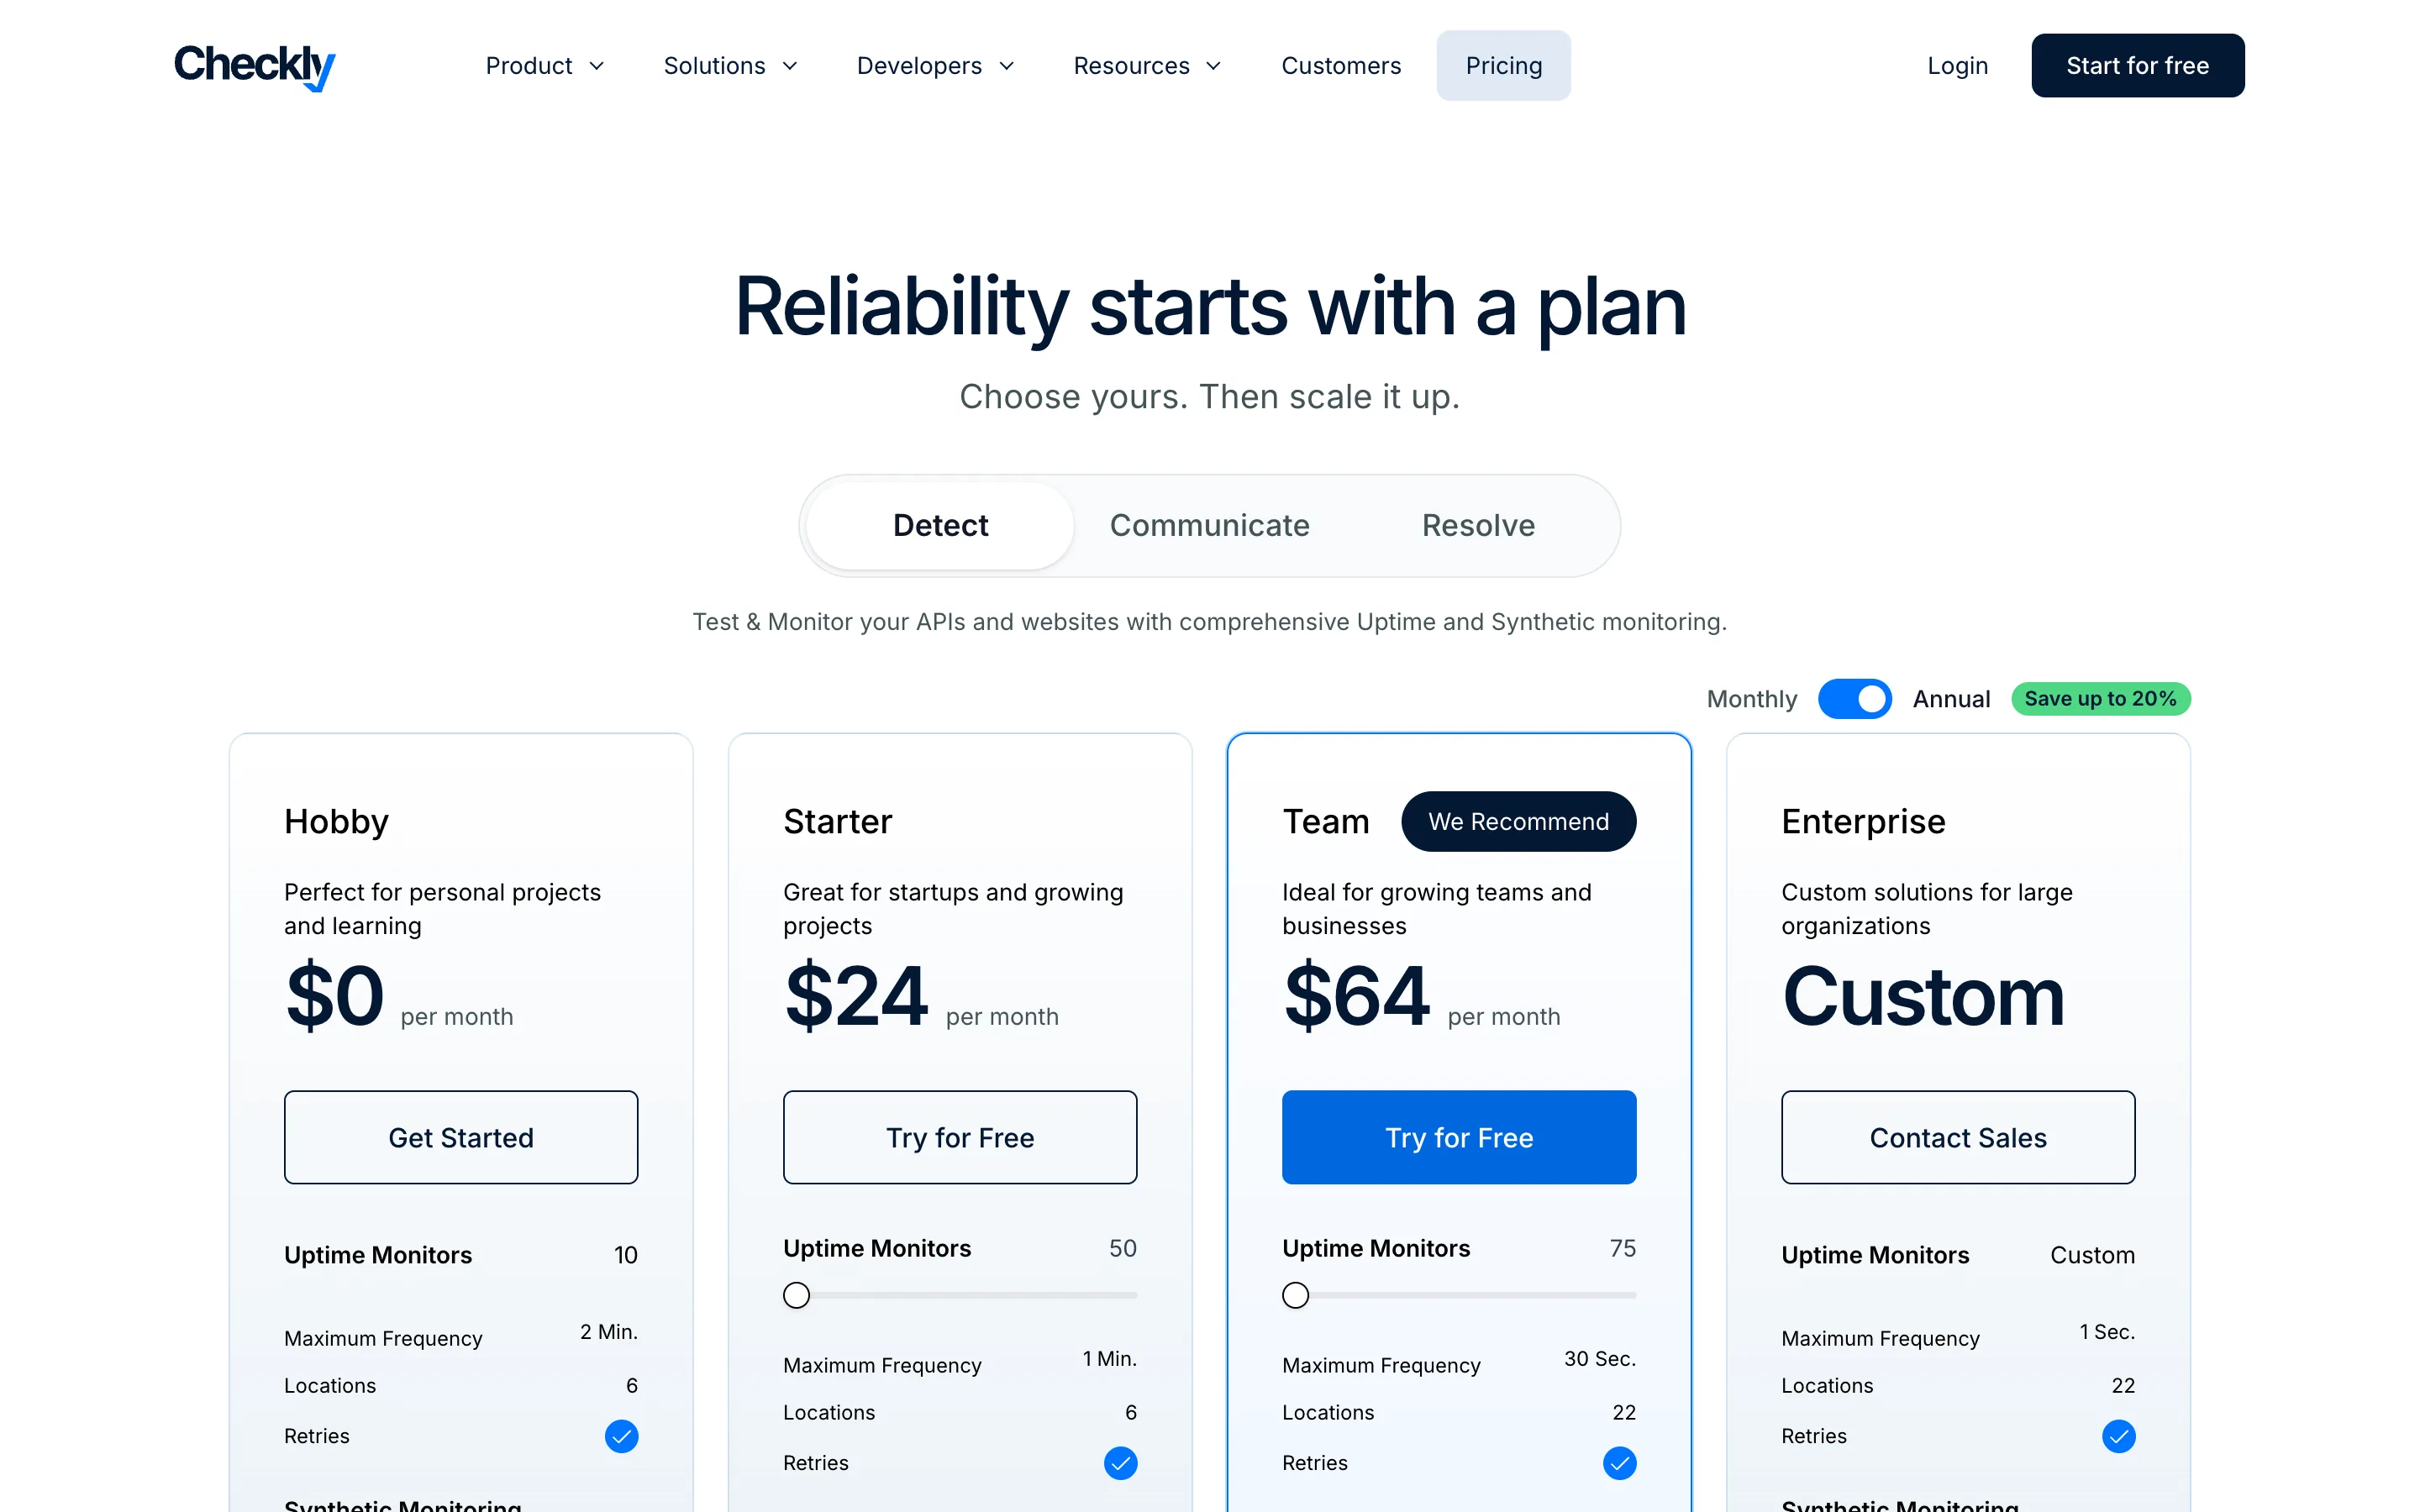
Checkly treats monitoring as code. Checks live in Git next to the Playwright tests they reuse, which means a browser check that walks a real signup flow is the same artifact your CI already runs. Annual pricing on September 17, 2026 is $0 for Hobby with 10 uptime monitors at 2-minute frequency and 6 locations, $24 per month for Starter with 50 monitors at 1 minute, and $64 per month for Team with 75 monitors at 30 seconds and 22 locations.
Watch the overages, because they are the part that surprises people: browser check runs beyond the included amount bill at $6.50 per 1,000 on Starter and $6.25 per 1,000 on Team.
Cronitor
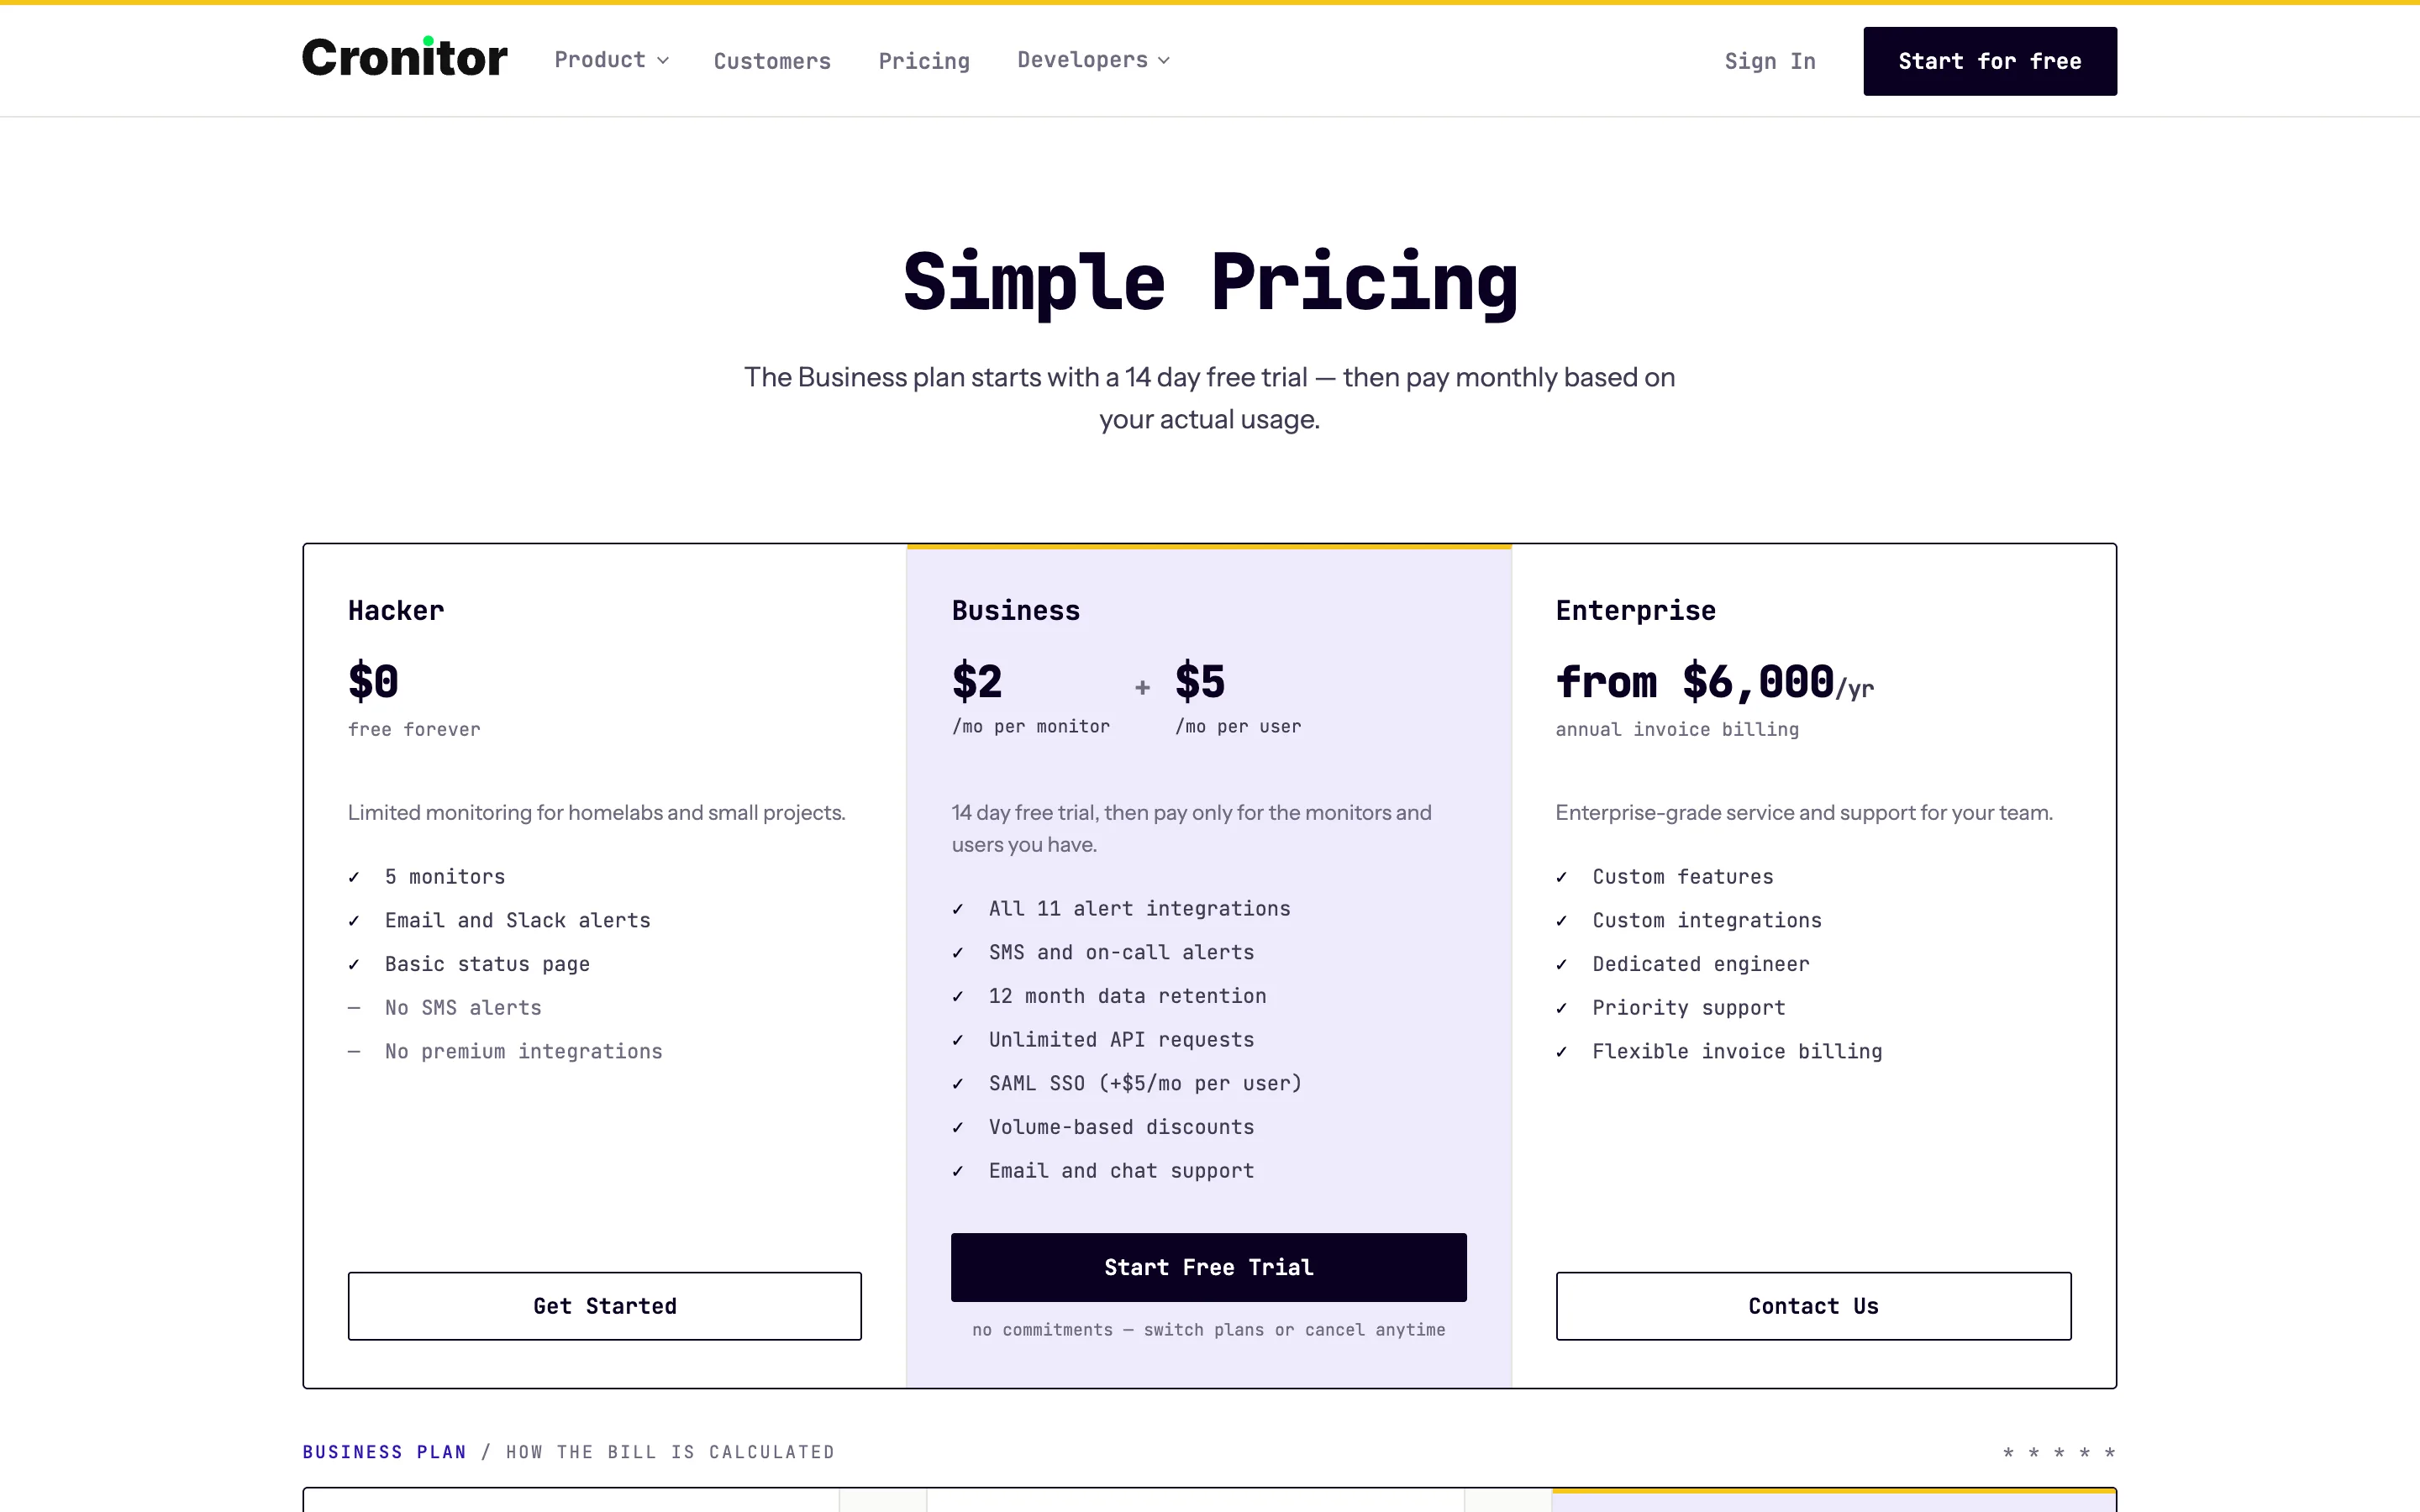
Cronitor started with cron job monitoring and still does that better than the generalists. Its model is unusual: the Hacker tier is free forever with 5 monitors, email and Slack alerts and a basic status page, and the Business tier charges $2 per month per monitor plus $5 per month per user with no base fee, reaching 30-second checks. Enterprise starts at $6,000 per year.
Per-monitor billing is excellent at 10 monitors and punishing at 200. If your problem is "did last night's backup job actually run", the heartbeat model is the right shape and the price is fair.
The Open-Source Options
Uptime Kuma
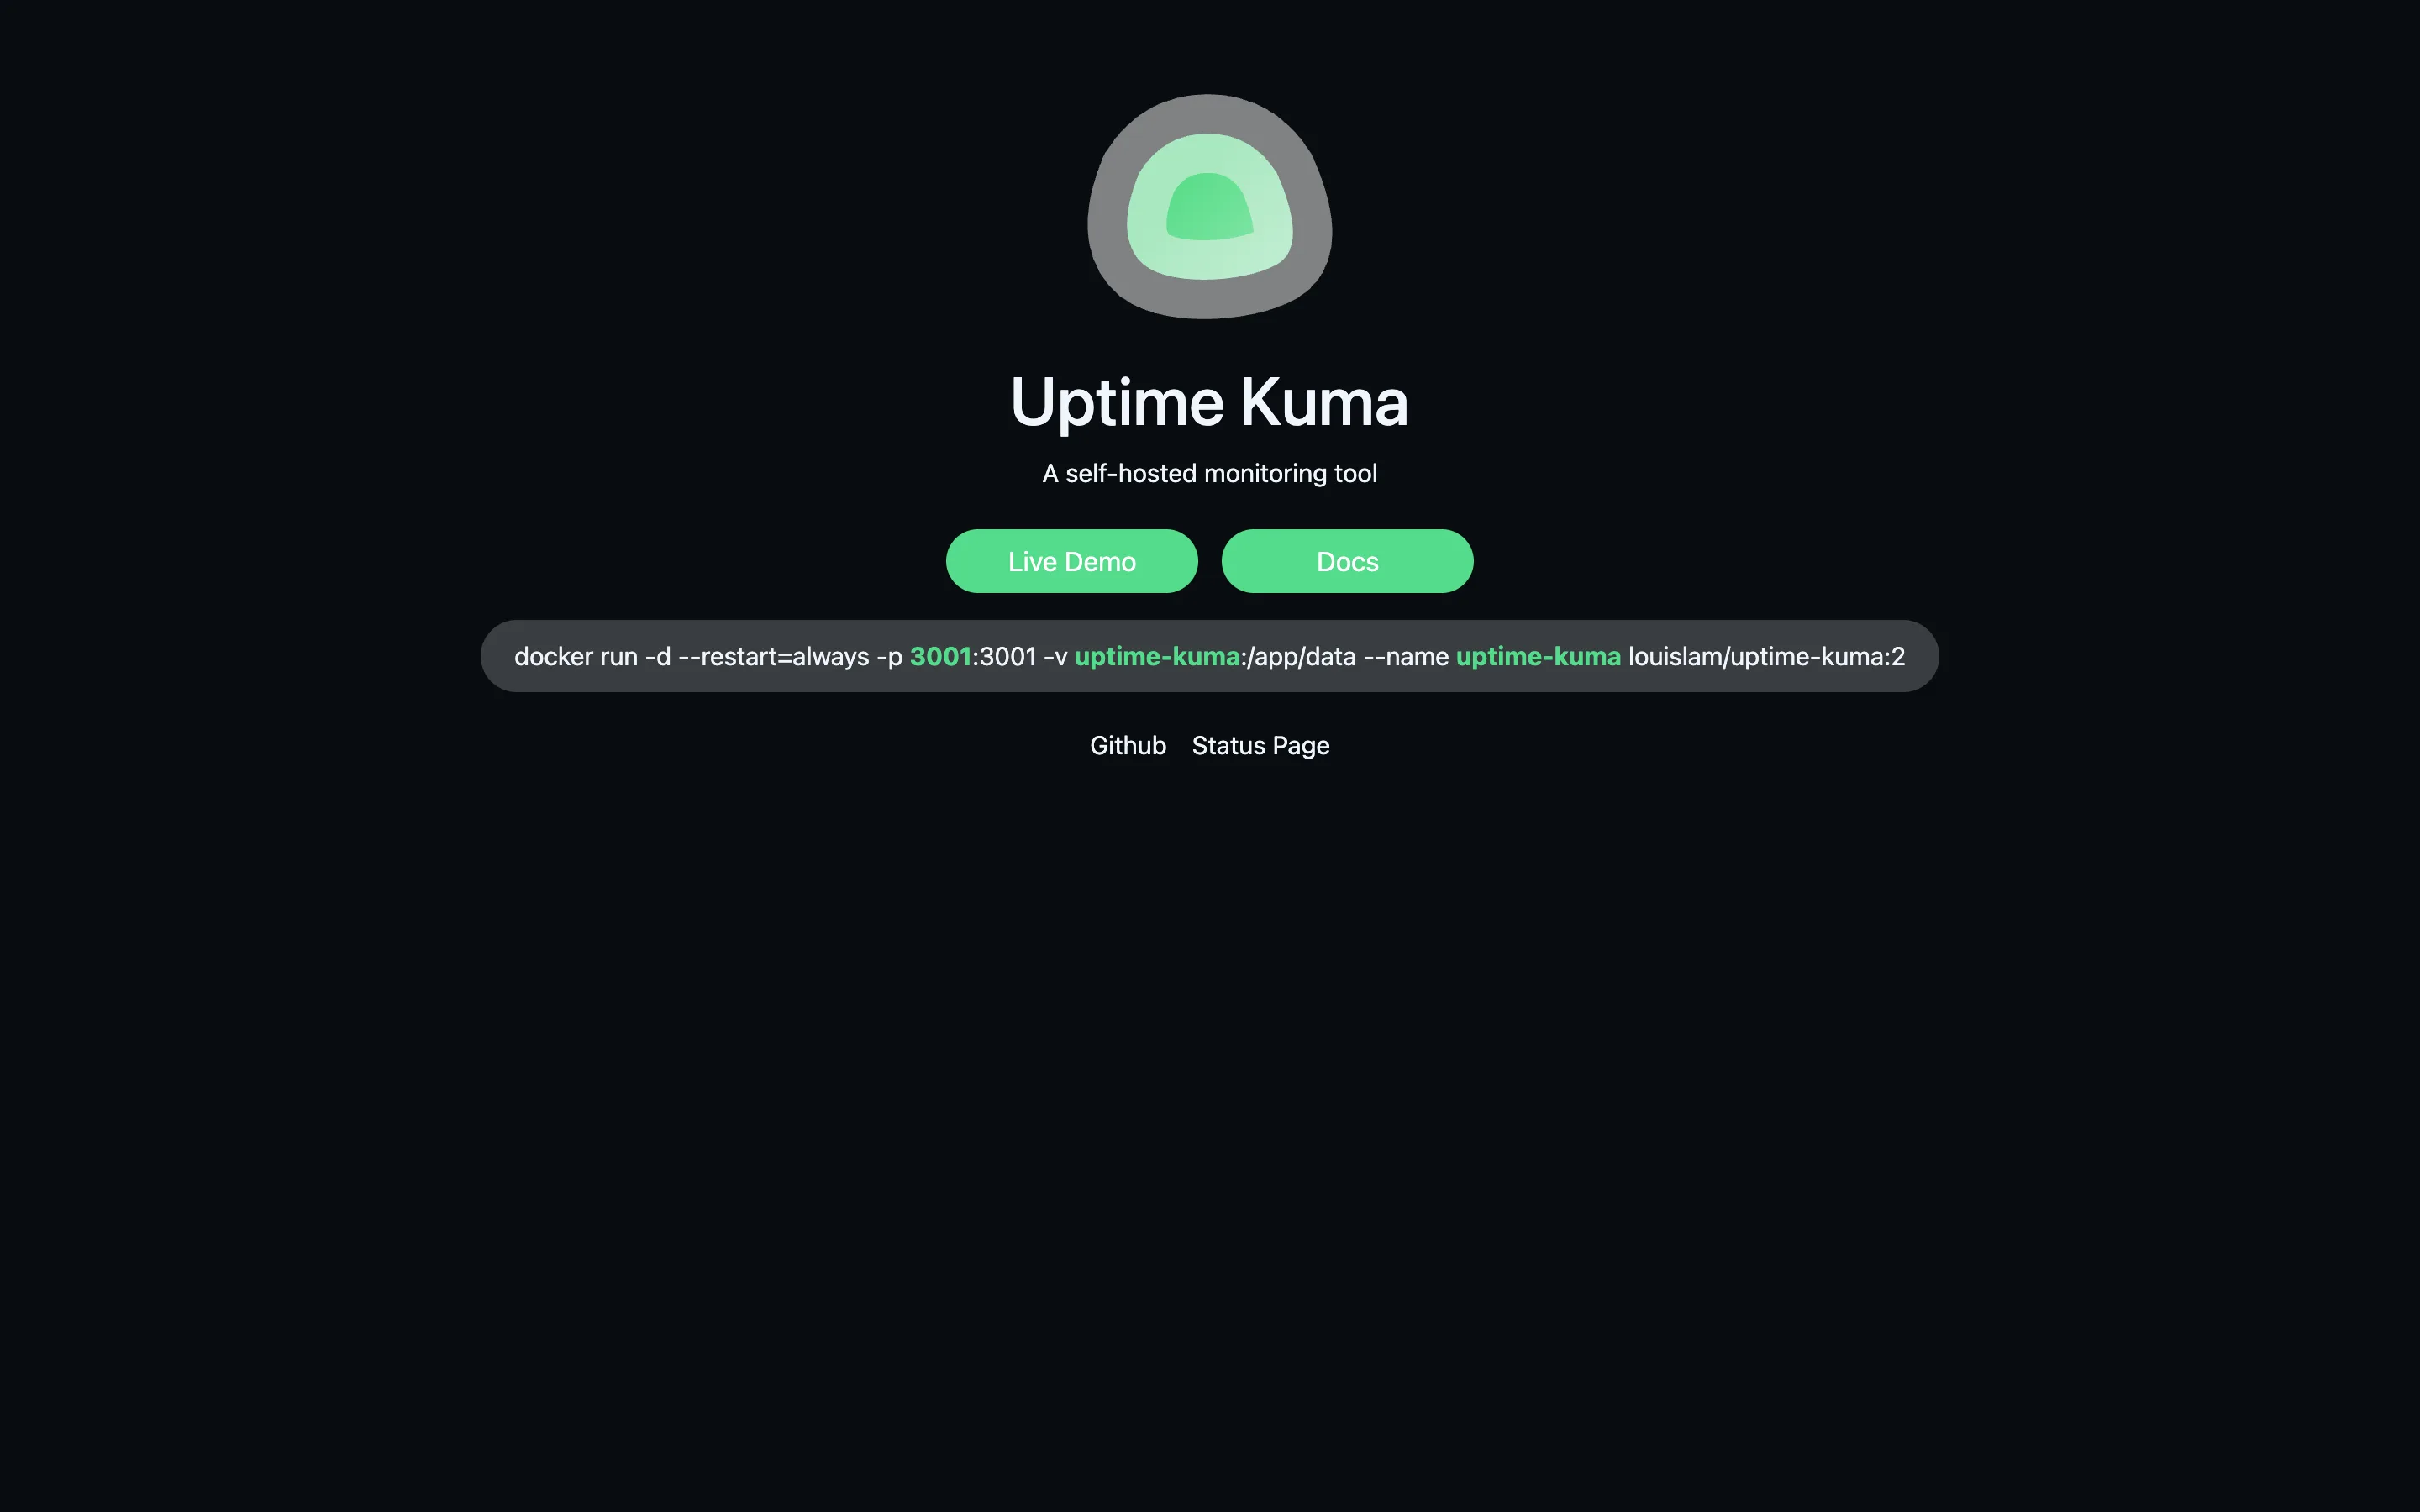
Uptime Kuma is the default self-hosted answer and the most popular project in this category by a wide margin: MIT licensed with 91,453 GitHub stars, with version 2.5.5 released on September 16, 2026 and commits landing the day after. It runs from a single docker run command, covers HTTP, TCP, ping, DNS and keyword checks, and ships status pages and about 90 notification integrations.
There is one structural limitation worth stating plainly. A monitor running on one box in one region tells you the service is unreachable from that box, which is not the same as down, and it cannot tell you anything while that box is the thing that failed.
Gatus
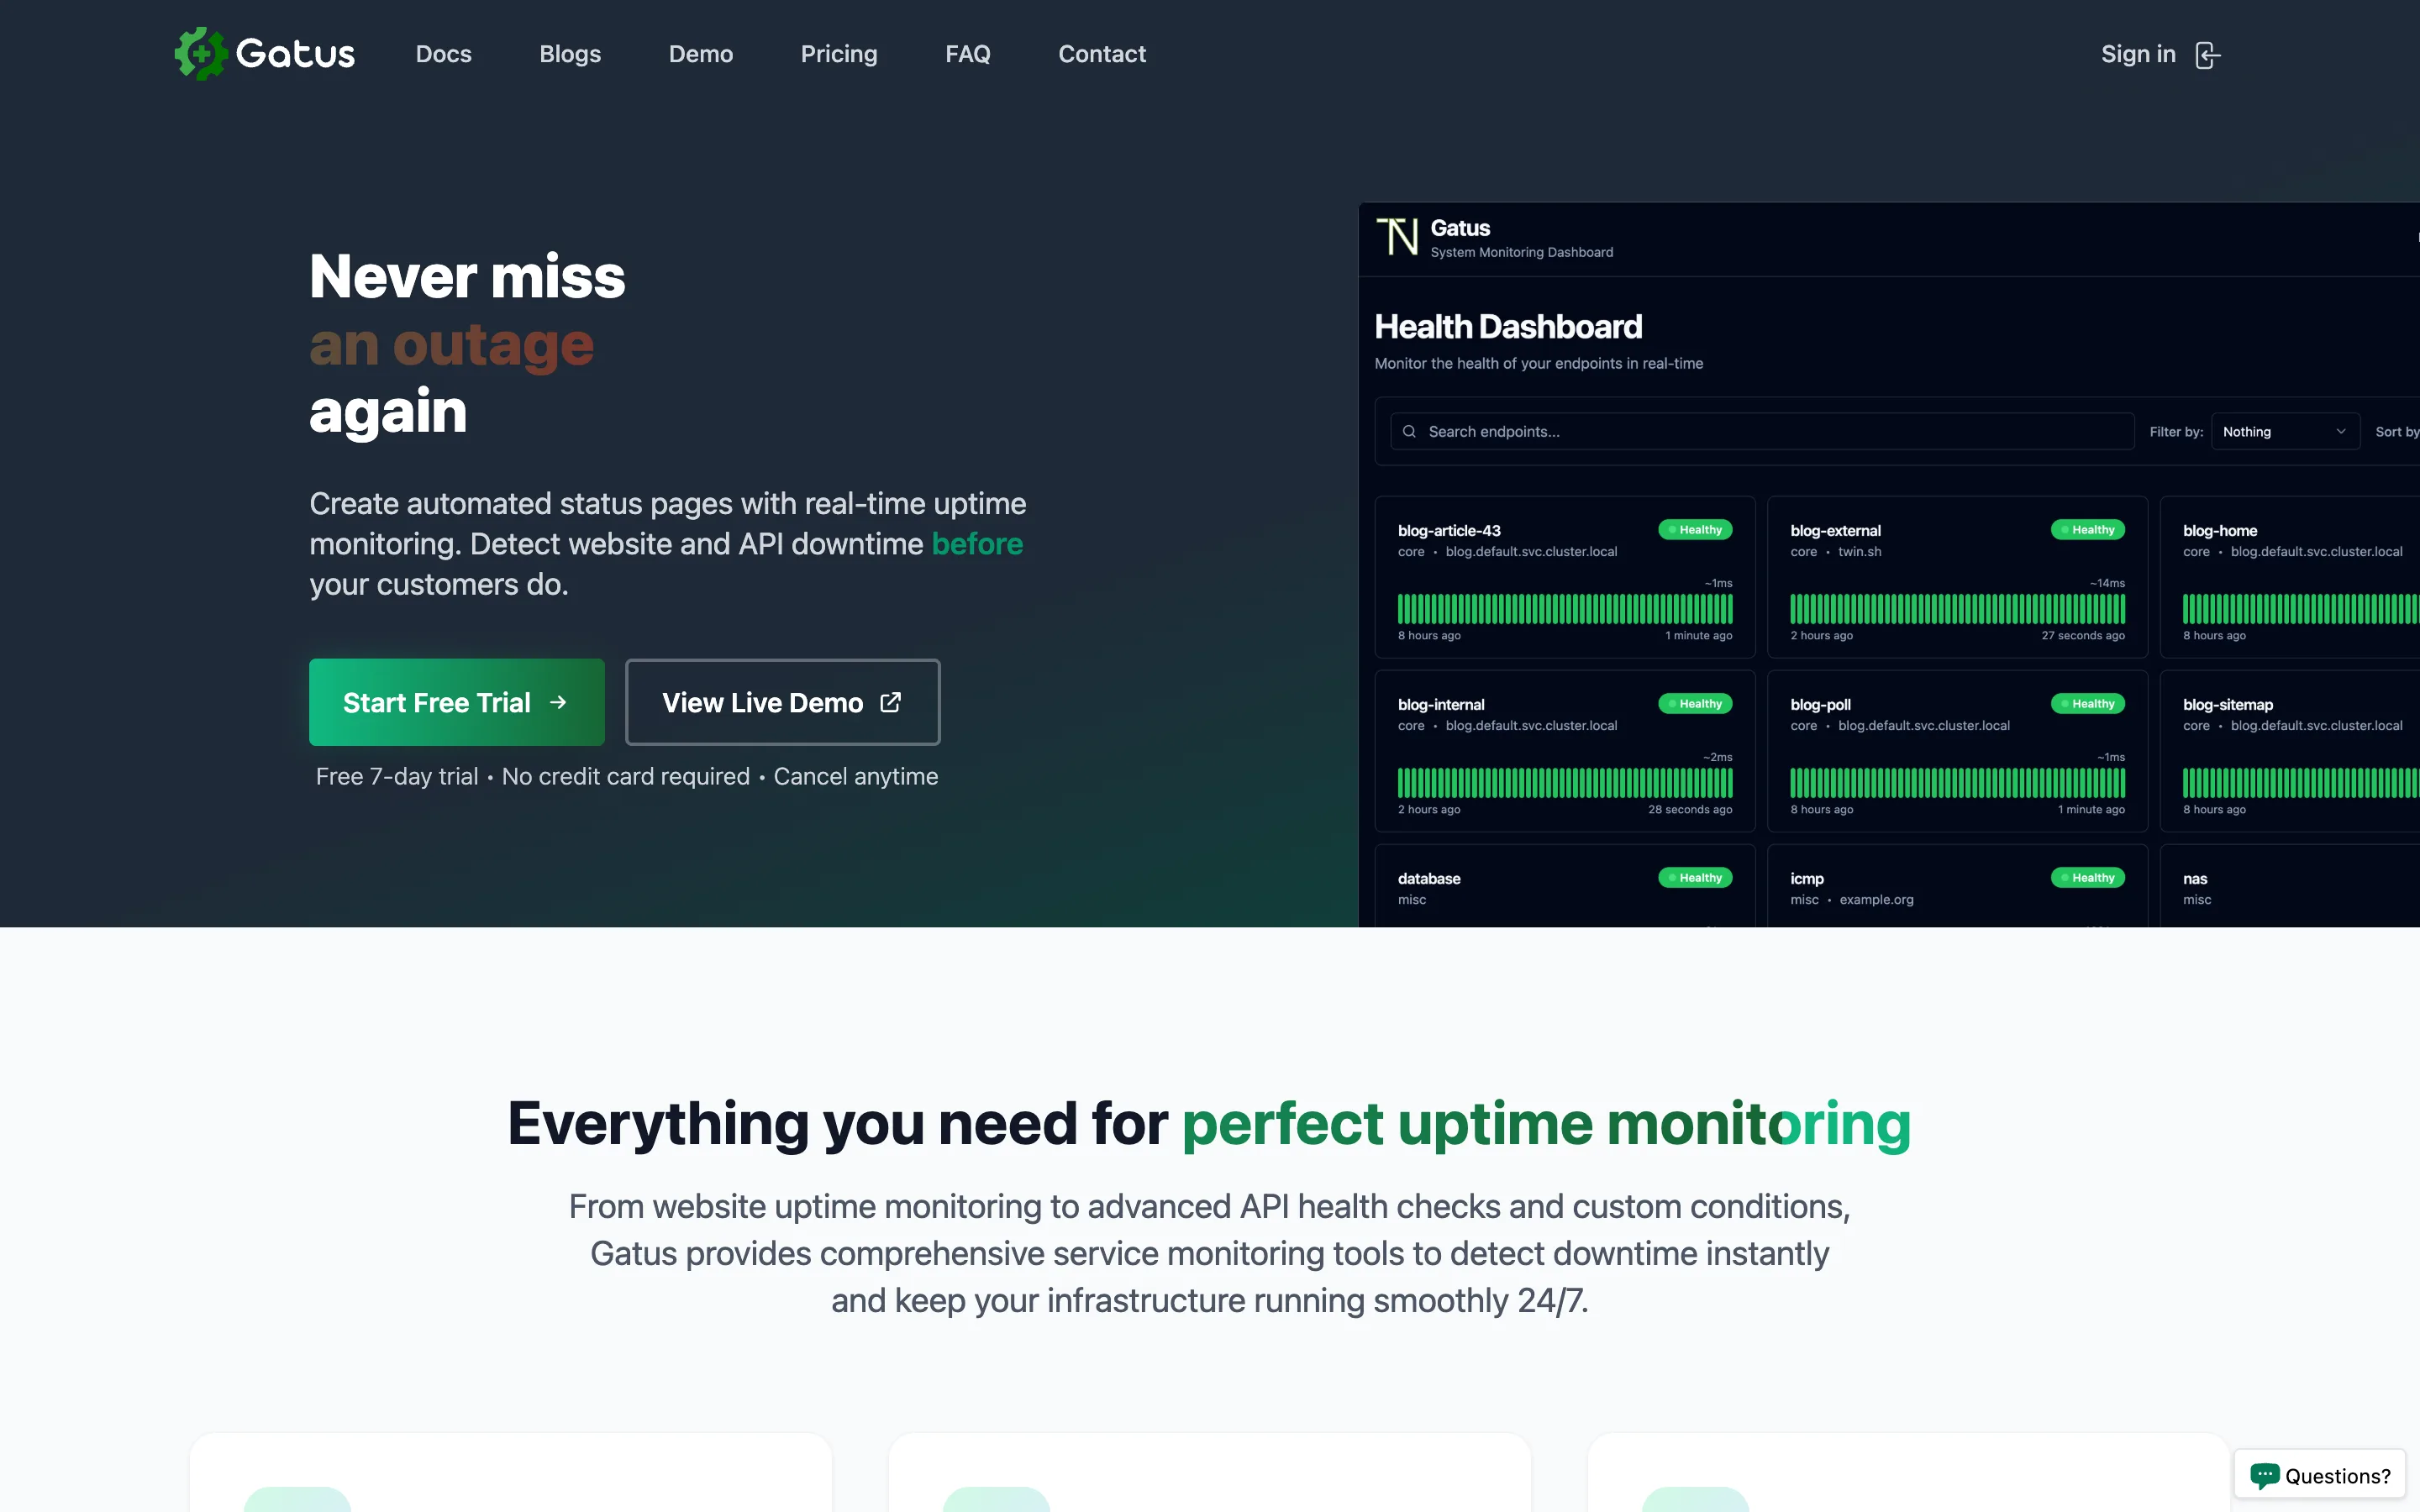
Gatus is Apache-2.0 licensed with 12,090 GitHub stars and version v5.36.0 released on May 19, 2026. It is configured entirely in YAML, which makes it the natural pick when monitors belong in the same repository as the infrastructure they watch, and its conditions syntax can assert on status code, response time and body content together rather than just reachability. Note that gatus.io now also sells a hosted version with a 7-day free trial; the self-hosted core remains Apache-2.0 on GitHub.
Upptime
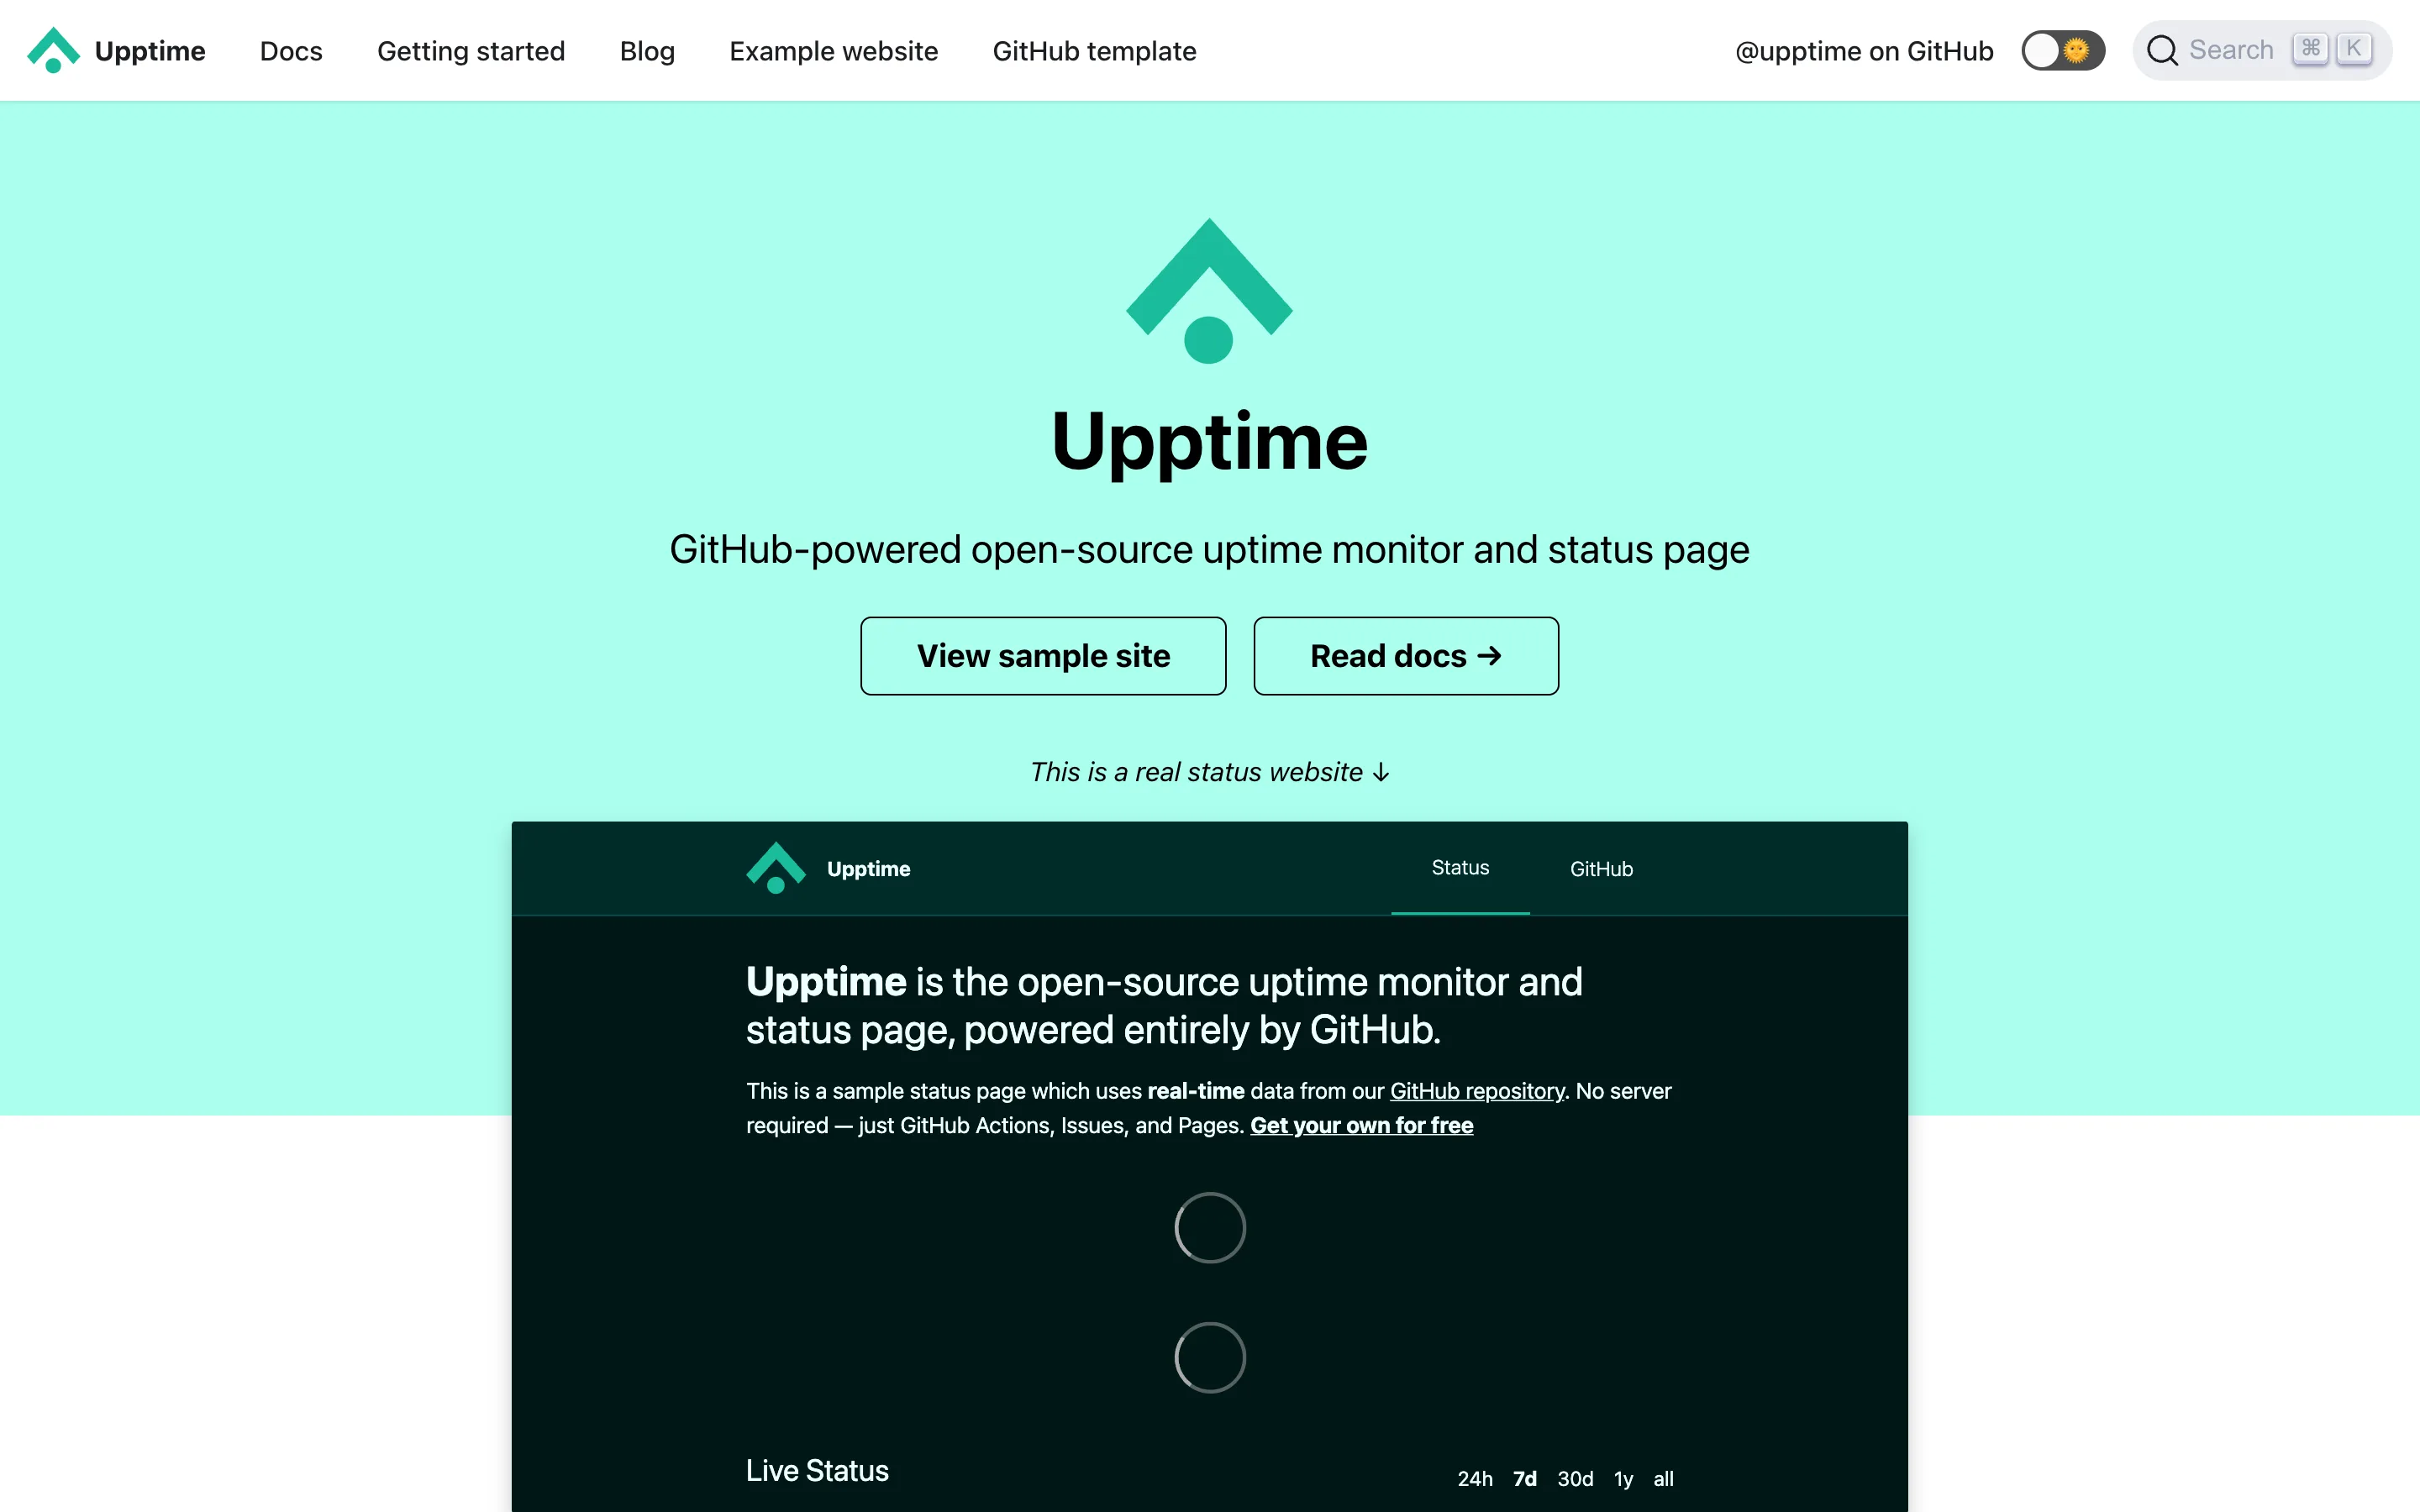
Upptime is the one with no server at all. It is MIT licensed with 17,157 GitHub stars and runs entirely on GitHub Actions, Issues and Pages, so checks execute on Actions runners, incidents open as issues, and the status page deploys to Pages. For an open-source project that already lives on GitHub, the running cost is zero and there is nothing to maintain.
Two honest caveats. GitHub Actions scheduling puts a practical floor around 5 minutes, so this is not a fast-detection tool, and the most recent tagged release is v2.0.0 from October 13, 2020, even though the repository still received commits on September 17, 2026. It works, but the tags do not tell you that.
Which One Should You Pick?
A side project or a marketing site: UptimeRobot's free tier. 50 monitors at 5 minutes costs nothing and covers more endpoints than any other free plan here.
You need sub-minute detection and have no budget: Checkly Hobby. It is the only free plan in the table that clears a 60-second mean detection time for 10 monitors.
You already run Docker and want unlimited monitors: Uptime Kuma, MIT licensed, on a small VPS. Put it in a different region from the thing it watches.
Monitors belong in Git with your infrastructure: Gatus for YAML config, or Checkly if the checks need to reuse Playwright tests.
Uptime and on-call should be one workflow: Better Stack, where the free tier includes the status page and the escalation policy rather than selling them separately.
Cron jobs and backups, not web pages: Cronitor. The heartbeat model fits the problem and $2 per monitor is honest at small scale.
An open-source project already on GitHub: Upptime, as long as 5-minute checks are acceptable.
Conclusion
The useful comparison is not price against price, it is cost per monitor against detection time, and those two rank the market differently. On the numbers verified September 17, 2026, UptimeRobot Scale is the cheapest paid slot at $0.33 per monitor, Checkly Hobby is the cheapest route to sub-minute detection at $0, and Uptime Kuma removes the per-monitor question entirely if you are willing to run a box and accept a single vantage point. Work out how many endpoints you have and how fast you need to know, run the script above against your own numbers, and the plan usually picks itself.
Related DevToolLab Tools
- URL Redirect Checker - trace the hops a monitored URL actually takes, so you find out your health check is following a 302 before the monitor does.
- HTTP Response Headers Checker - inspect exactly what a health endpoint returns, including the cache headers that make a monitor read a stale 200.
- Cron Expression Generator - build the schedule for the job you are about to put a heartbeat monitor on, and confirm it fires when you think.
- Latency Percentile Calculator - turn raw response times into p95 and p99 so an alert threshold reflects real behavior instead of an average.
Related Guides
- 7 Datadog Alternatives and What They Cost - the full observability platforms, priced on one identical workload.
- Best Sentry Alternatives in 2026 - error tracking, which answers a different question than uptime.
- Best eBPF Observability Tools in 2026 - zero-code instrumentation for what is happening inside the service that is up.
- OpenTelemetry Node.js Setup Guide 2026 - traces, metrics and logs once a monitor tells you something is wrong.