
Observability bills are usage-based, so the volume your services emit sets them rather than anything you agreed to in advance. A debug log left on in a hot path, or an autoscaler that doubles your host count overnight, moves the invoice before anyone opens a dashboard.
Datadog reported revenue of $1.12 billion for the second quarter of 2026, up 36 percent year over year, and approximately 4,720 customers spending $100,000 or more in annual recurring revenue, up 23 percent from about 3,850 a year earlier (Datadog press release, August 6, 2026). Six-figure observability contracts are the model, not an edge case.
What Teams Actually Run
Cost is the single most important tool selection criterion in observability for the third year running, cited by 65 percent of respondents against 49 percent for ease of use, according to the Grafana Labs 4th Annual Observability Survey, published March 18, 2026 from 1,363 responses collected across 76 countries between October 1, 2025 and January 6, 2026.
Open standards are close to universal in that sample: 77 percent are investing in Prometheus, 76 percent in OpenTelemetry, 65 percent in both. That last number is why switching is easier than it was three years ago. If your services already emit OpenTelemetry, the agent is no longer the lock-in: the backend becomes a routing line in a collector config, and every platform below accepts OTLP.
Pricing One Workload Across Five Vendors
Vendor pages quote their own best case. The useful exercise is pushing one workload you actually run through each rate card. This script prices 50 hosts, 3,000 GB of logs a month and 5 engineers needing full platform access, at list rates published on September 10, 2026.
js// price.mjs - node price.mjs const workload = { hosts: 50, logGBPerMonth: 3000, fullUsers: 5 } const plans = { // datadoghq.com/pricing, annual commitment Datadog: ({ hosts, logGBPerMonth }) => hosts * 15 + hosts * 31 + logGBPerMonth * 0.1, // newrelic.com/pricing, Standard edition, 100 GB ingest free 'New Relic': ({ logGBPerMonth, fullUsers }) => Math.max(0, logGBPerMonth - 100) * 0.4 + 10 + (fullUsers - 1) * 99, // grafana.com/pricing, Pro: $19 base, 50 GB free, then process+write+retain 'Grafana Cloud': ({ logGBPerMonth }) => 19 + Math.max(0, logGBPerMonth - 50) * (0.05 + 0.4 + 0.1), // signoz.io/pricing, $0.30/GB logs and traces, $49 monthly minimum SigNoz: ({ logGBPerMonth }) => Math.max(49, logGBPerMonth * 0.3), // openobserve.ai/pricing, $0.50/GB ingested OpenObserve: ({ logGBPerMonth }) => logGBPerMonth * 0.5, } const usd = (n) => '$' + n.toLocaleString('en-US', { maximumFractionDigits: 0 }) const rows = Object.entries(plans) .map(([name, fn]) => ({ name, monthly: fn(workload) })) .sort((a, b) => a.monthly - b.monthly) const base = rows.find((r) => r.name === 'Datadog').monthly for (const r of rows) { const delta = ((r.monthly / base - 1) * 100).toFixed(0) console.log( r.name.padEnd(15), usd(r.monthly).padStart(8) + '/mo', usd(r.monthly * 12).padStart(10) + '/yr', r.name === 'Datadog' ? 'baseline' : `${delta}% vs Datadog`, ) }
Real output:
textSigNoz $900/mo $10,800/yr -65% vs Datadog OpenObserve $1,500/mo $18,000/yr -42% vs Datadog New Relic $1,566/mo $18,792/yr -40% vs Datadog Grafana Cloud $1,642/mo $19,698/yr -37% vs Datadog Datadog $2,600/mo $31,200/yr baseline
The spread is real but roughly 2x to 3x, not the 30x some vendors advertise, because at 50 hosts most of the Datadog bill is per-host APM at $31 per host per month rather than log volume. Ingestion is only $300 of that $2,600, so cutting log volume optimizes the smallest line item. Indexing is where log spend escalates: at $1.70 per million events on an annual commitment, 200 million indexed events adds $340 a month.
Grafana Cloud
Grafana Cloud is the hosted version of the stack many teams already self-host, the least disruptive migration here if your dashboards are already Grafana.
The free tier is unusually generous: 10,000 active metric series, 50 GB each of logs and traces monthly, 14-day retention, 3 users. Pro adds a $19 monthly fee, with logs and traces billed in three parts starting at $0.05 per GB to process, $0.40 to write and $0.10 to retain, and metrics from $6.50 per 1,000 series.
What it does not give you is a single number to forecast; that three-part rate is the most complex model here. Pricing: Free tier · Pro from $19/month plus usage. Grafana itself is AGPL-3.0.
New Relic
New Relic prices on data volume and user seats, the clearest apples-to-apples comparison against Datadog's per-host billing.
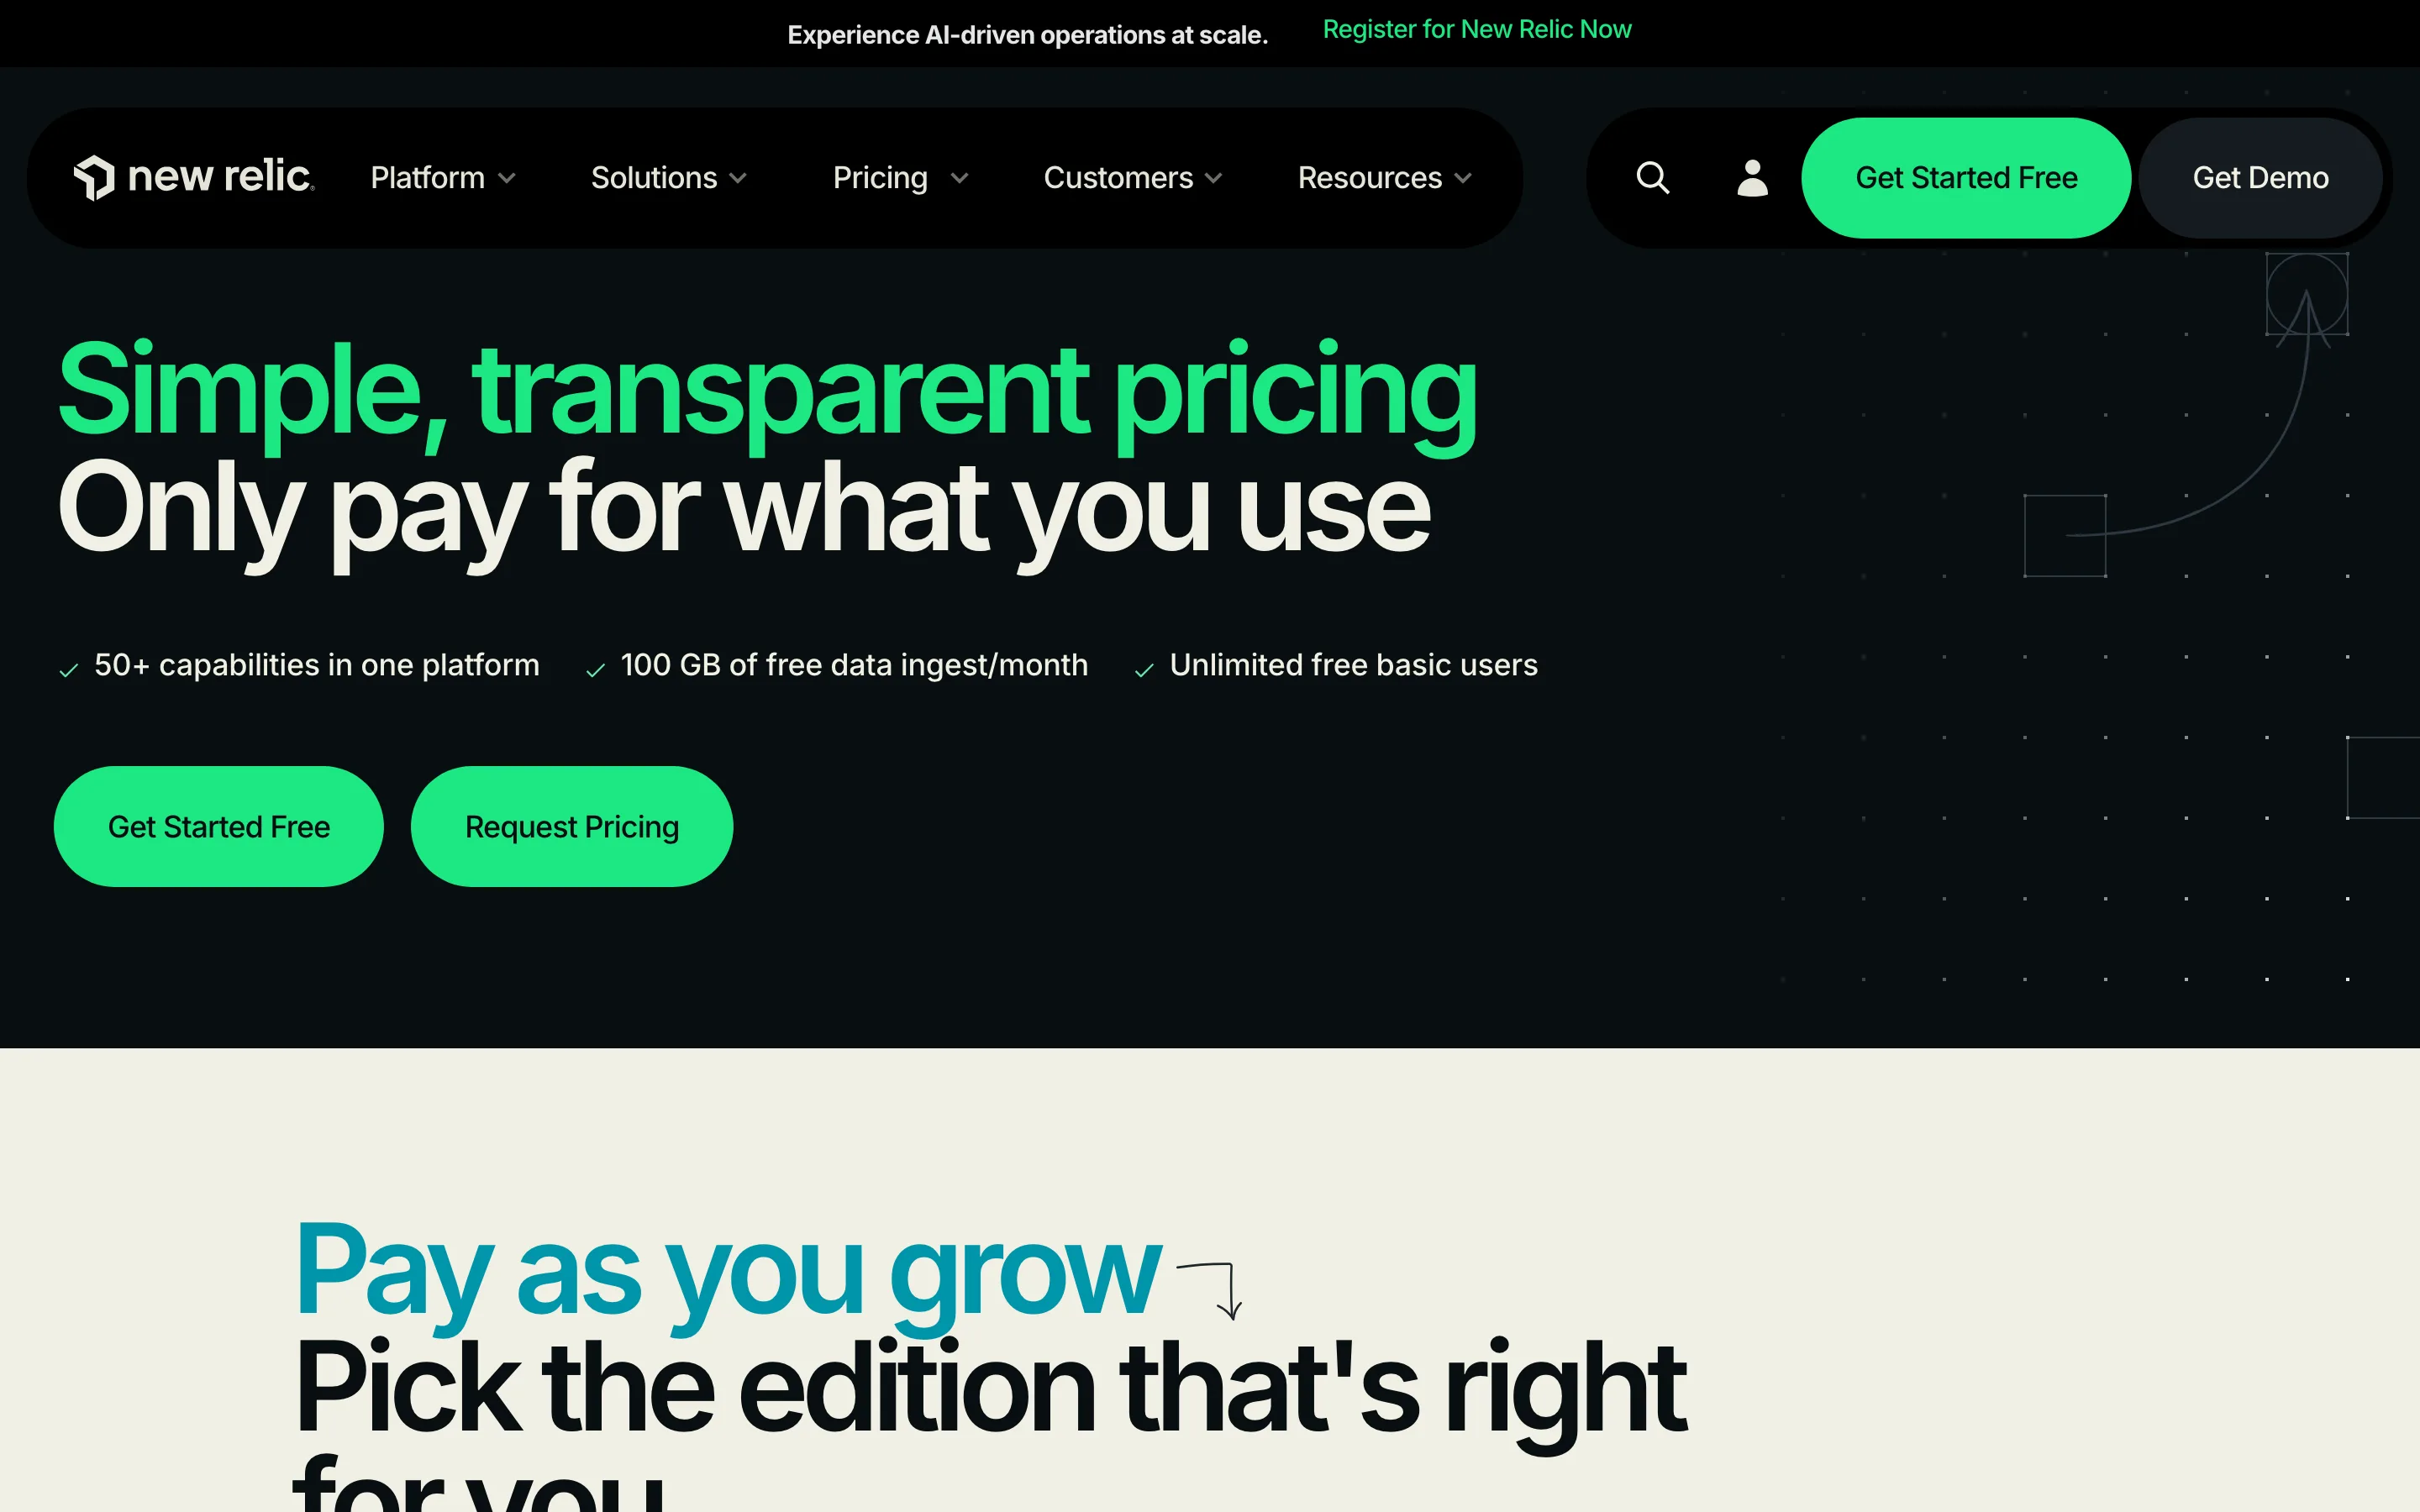
Every account gets 100 GB of ingest a month free plus unlimited basic users, the largest no-cost allowance of any commercial platform here. Ingest beyond that is $0.40 per GB, or $0.60 with Data Plus. Seats are the expensive part: full platform users cost $10 for the first and $99 each up to five on Standard, jumping to $349 per user annually on Pro.
That punishes the teams that benefit most: a 30-engineer organization pays more for access than for data. Pricing: 100 GB/month free · $0.40/GB ingest · $99 per full user on Standard.
Better Stack
Better Stack bundles logs, metrics, traces, uptime monitoring, on-call and status pages into one product, removing a second and third vendor rather than only Datadog.
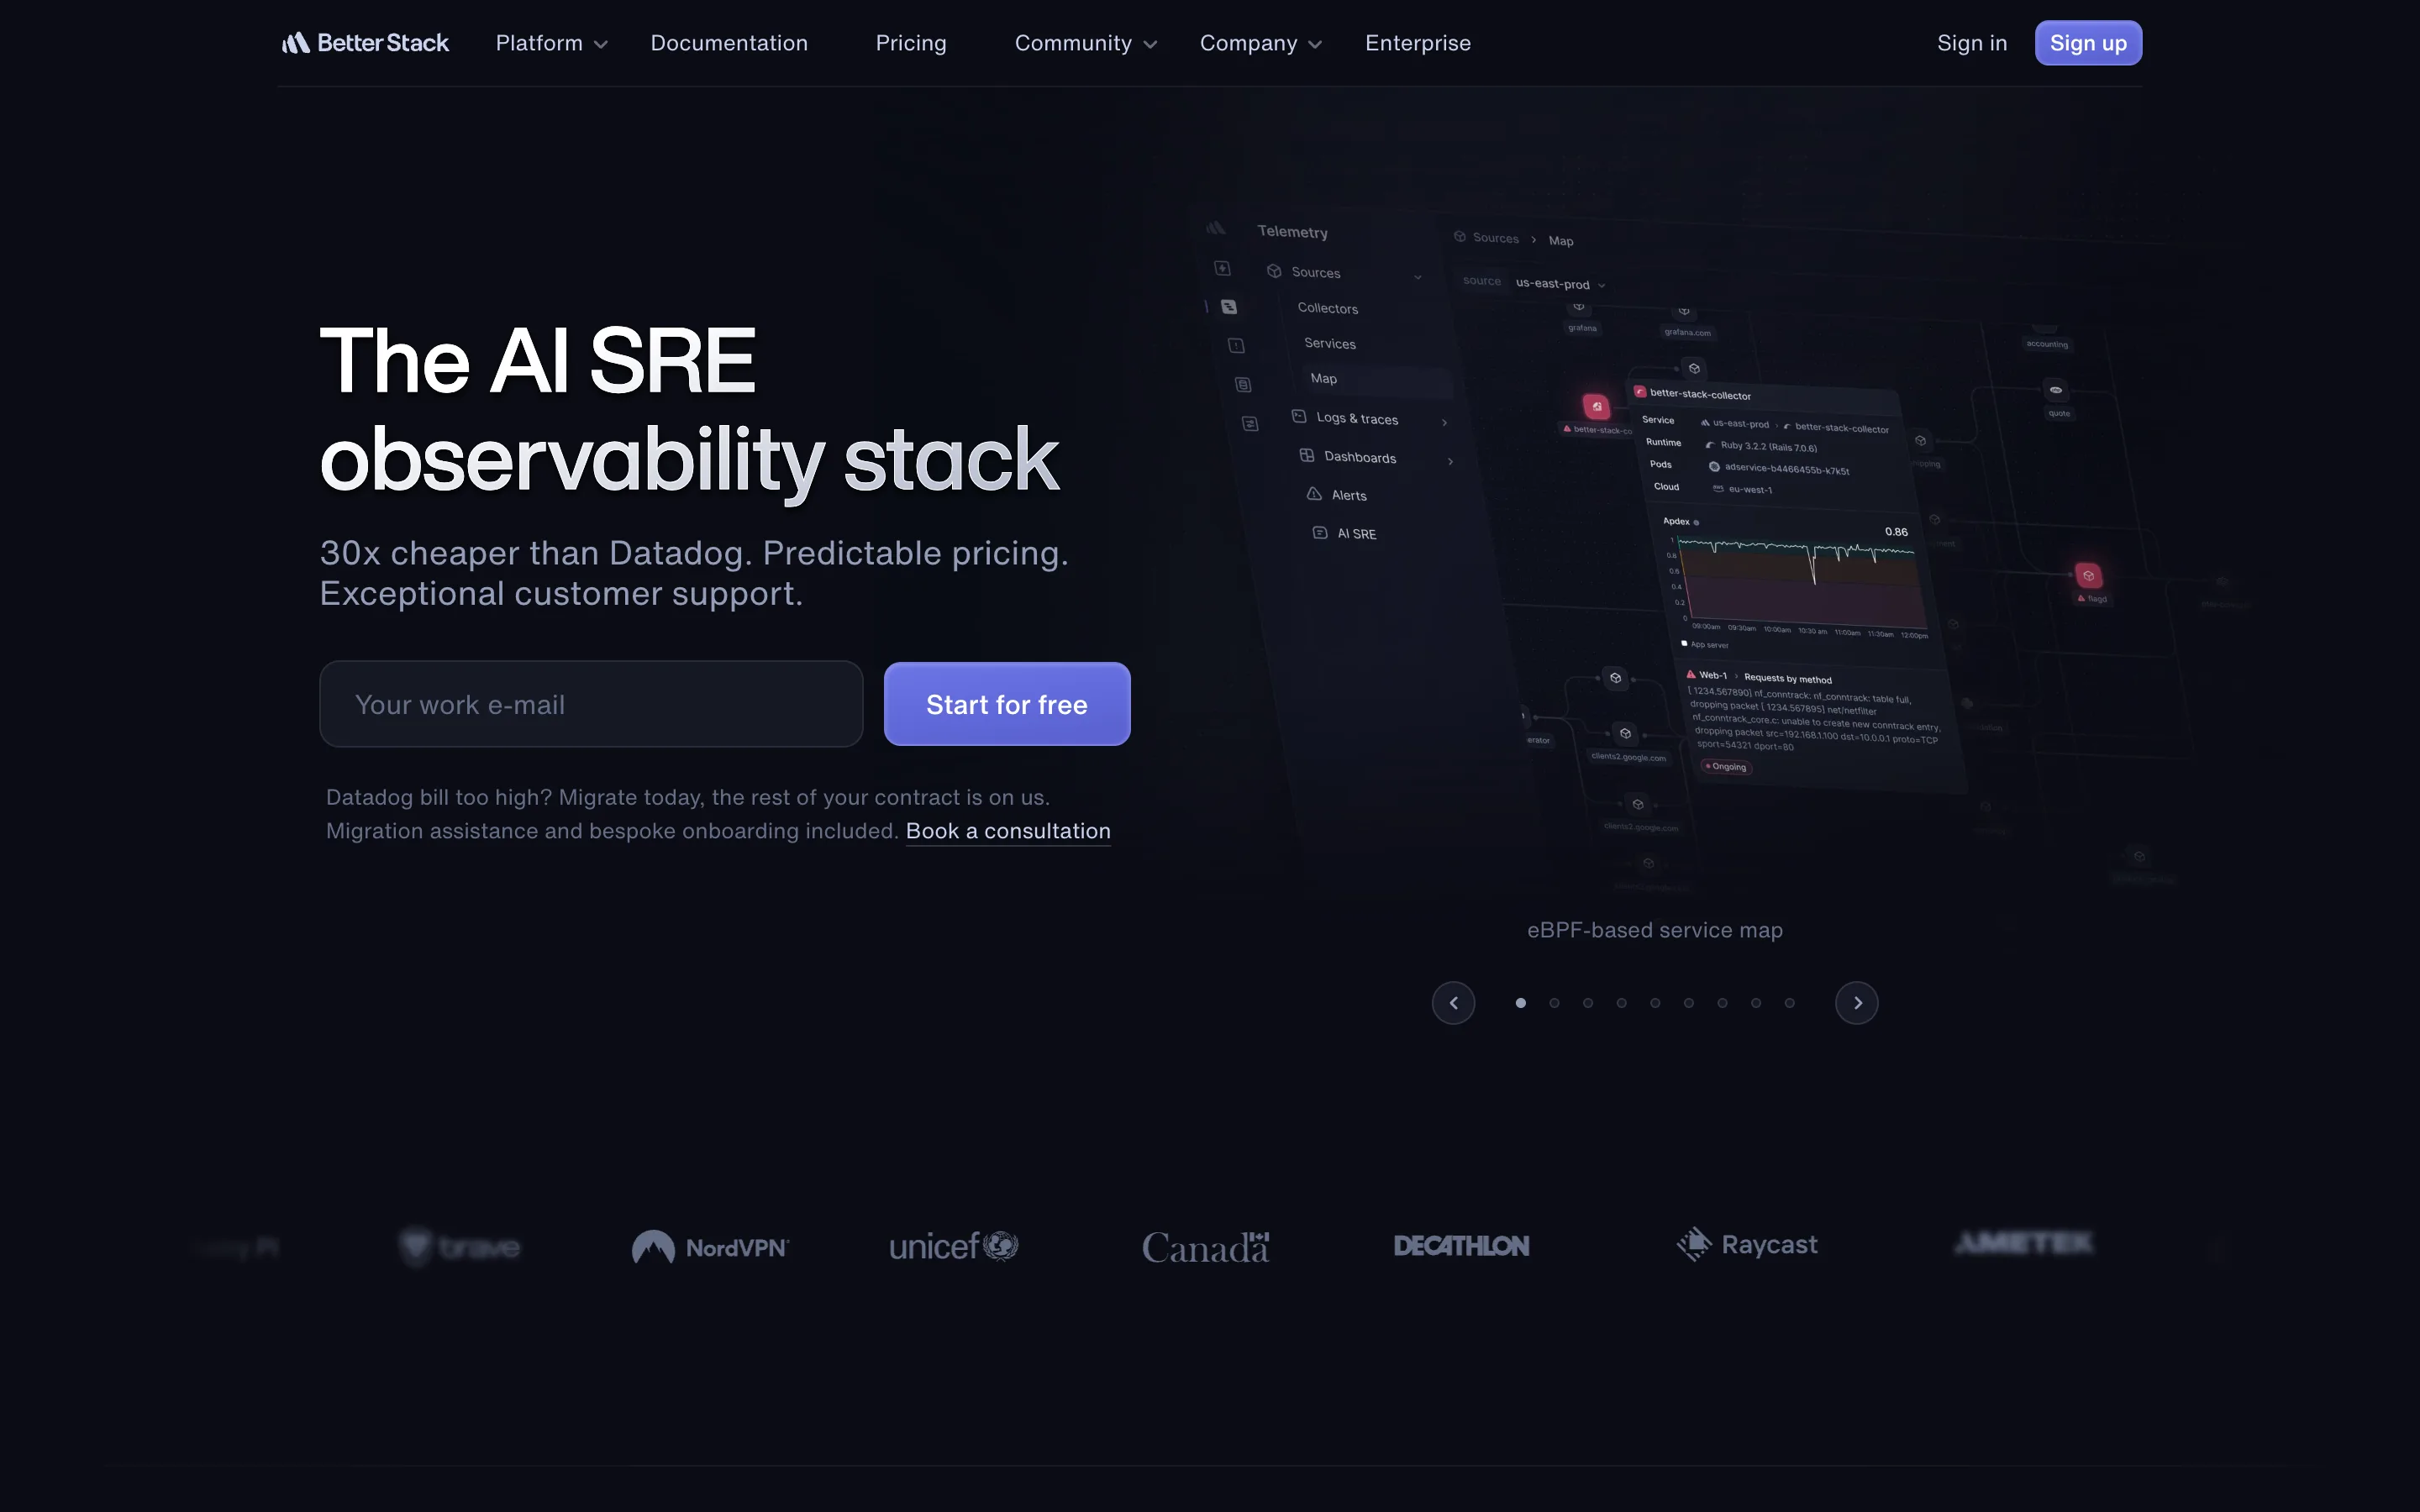
Pricing is bundled, not metered. Nano is $30 a month for 40 GB each of logs, traces and metrics, Micro $120 for 160 GB, Mega $250 for 340 GB and Tera $500 for 700 GB, all with 30-day log retention, and annual billing takes about 16 percent off. The free tier is 3 GB a month kept for 3 days.
The bundles are the limitation as much as the feature. They top out at 700 GB per signal, so the 3,000 GB workload above fits no tier and becomes a sales conversation, and each tier buys logs, traces and metrics in equal amounts whether or not your traffic is. Pricing: Free 3 GB/month · Nano $30/month · Tera $500/month.
Axiom
Axiom is a schema-less event store rather than a conventional observability suite, built to keep everything rather than sample it.
The free Personal tier allows 500 GB of data loading a month, 10 GB-hours of query compute, 25 GB of storage and 30-day retention, easily the largest free ingest allowance here. Axiom Cloud is $25 a month including 1 TB of loading, 100 GB-hours of compute and 100 GB of storage.
Axiom meters loading, compute and storage separately and publishes no plain per-GB overage rate, calling volume discounts automatic and sub-linear instead. That makes a large month hard to model in advance, the exact problem teams leaving Datadog are trying to solve. Pricing: Free 500 GB/month · Axiom Cloud $25/month including 1 TB.
SigNoz
SigNoz is the closest thing to a drop-in open source Datadog replacement: OpenTelemetry-native, built on ClickHouse, covering traces, metrics and logs in one application.
The core is MIT licensed with the ee/ and cmd/enterprise/ directories under a separate enterprise license, so it is open core rather than fully permissive. SigNoz Cloud charges $0.30 per GB for logs and traces at 15-day retention and $0.10 per million metric samples, with a $49 monthly minimum that includes $49 of usage.
Self-hosting means running and tuning ClickHouse. At 3 TB a month that is a cluster somebody has to own, and the $900 cloud figure buys you out of it. Pricing: Community edition free · Cloud $0.30/GB logs, $49/month minimum. MIT core, about 32,000 stars, v0.141.1 as of September 9, 2026.
OpenObserve
OpenObserve is a Rust platform that stores telemetry in object storage such as Amazon S3 rather than local disk, which is what puts its storage price below index-based systems.
Cloud pricing is $0.50 per GB ingested and $0.01 per GB queried, with 30-day retention for logs, traces and RUM, 15 months for metrics, and no per-host or per-seat fees. Self-hosted, the first 50 GB a day is free, SSO and RBAC included.
Check AGPL-3.0 before deploying it: offering a modified OpenObserve as a service carries obligations MIT and Apache 2.0 do not. Pricing: Self-hosted free to 50 GB/day · Cloud $0.50/GB ingested. AGPL-3.0, about 21,700 stars, stable v0.92.2 as of August 17, 2026, with a v1.0.0 release candidate line since August 28, 2026.
VictoriaLogs
VictoriaLogs is the logs database from the VictoriaMetrics project, and the pick when you want a component rather than a platform.
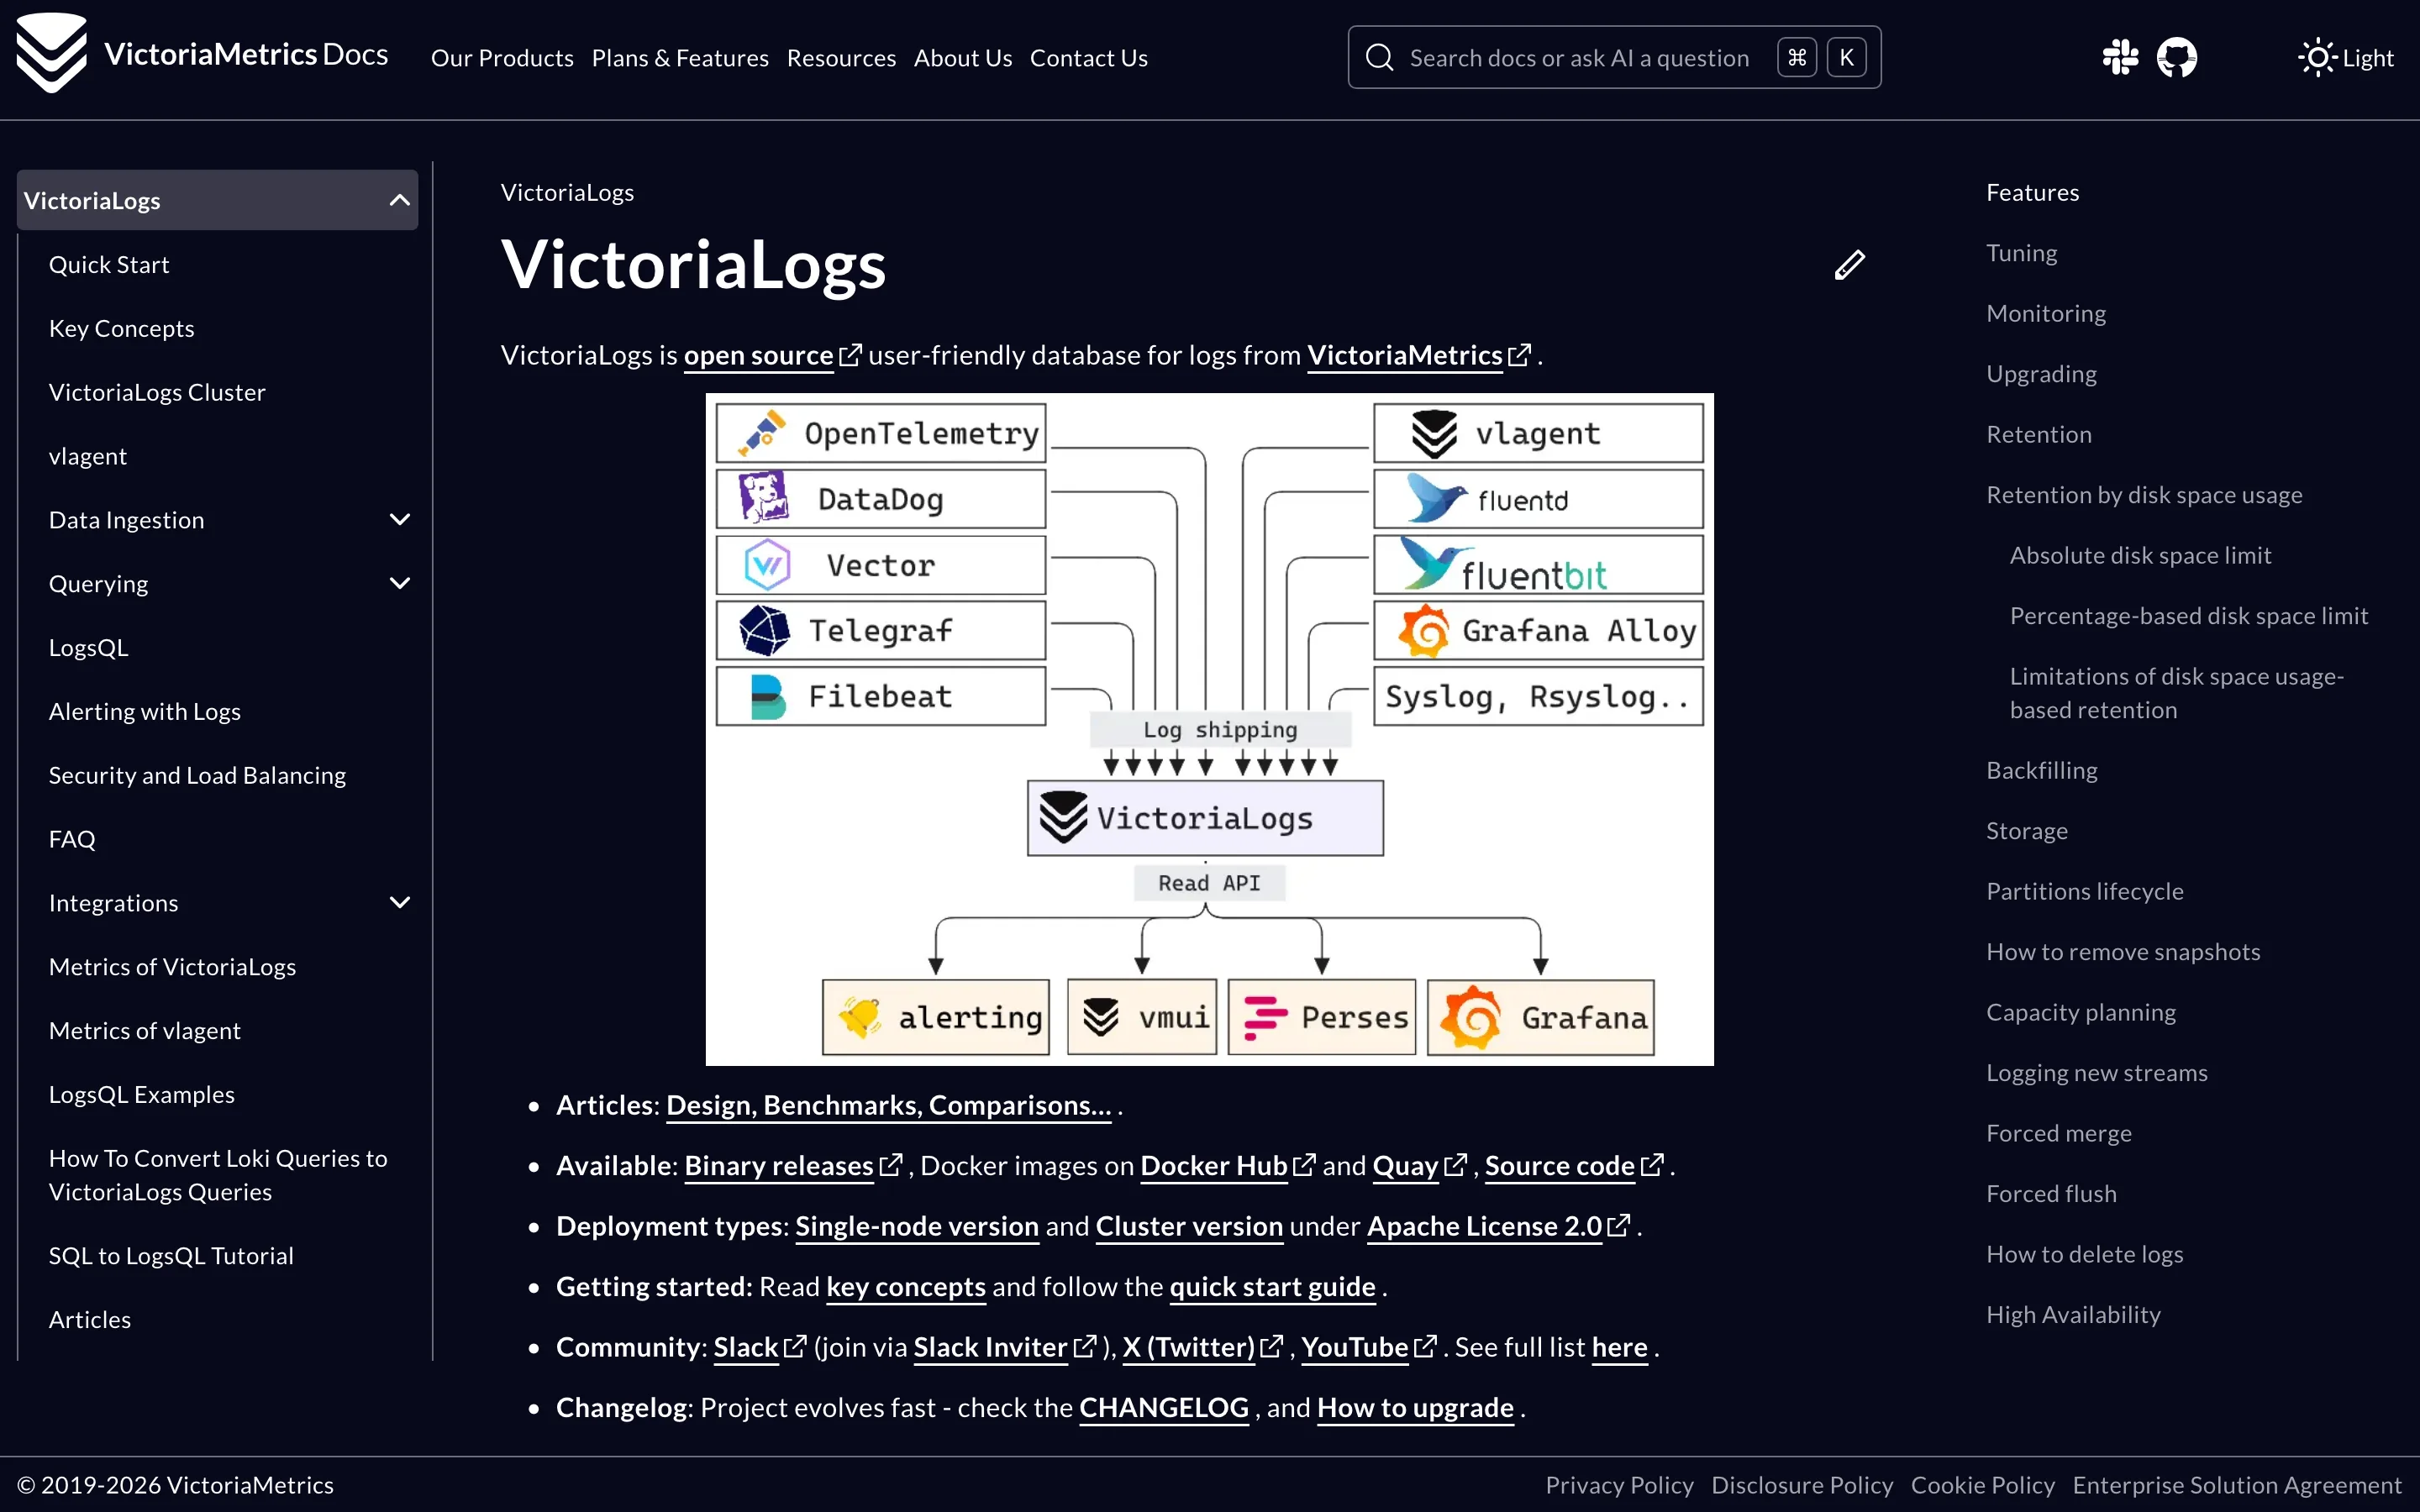
Both single-node and cluster versions are Apache License 2.0 with no open-core carve-out, the most permissive licensing here. Its documentation claims up to 30x less RAM and 15x less disk than Elasticsearch and Grafana Loki, and it ingests from OpenTelemetry, Datadog agents, Vector, Filebeat, Fluentd, Fluent Bit, Grafana Alloy and syslog.
It is not a product. There is no unified trace UI, no incident management and no on-call rotation; you assemble the rest yourself. Pricing: Free, self-hosted. Apache 2.0, VictoriaLogs v1.52.0 as of July 16, 2026, VictoriaMetrics core v1.151.0 as of August 31, 2026.
Side by Side
| Platform | Model | Free tier | Entry price | Self-host | License |
|---|---|---|---|---|---|
| Datadog | Per host + per GB | 14-day trial | $15/host/month | No | Proprietary |
| Grafana Cloud | Per series + per GB | 50 GB logs, 3 users | $19/month + usage | Yes | AGPL-3.0 |
| New Relic | Per GB + per seat | 100 GB/month | $0.40/GB | No | Proprietary |
| Better Stack | Bundled tiers | 3 GB/month | $30/month | No | Proprietary |
| Axiom | Load + compute + storage | 500 GB/month | $25/month | No | Proprietary |
| SigNoz | Per GB | Community edition | $49/month minimum | Yes | MIT core |
| OpenObserve | Per GB | 50 GB/day self-hosted | $0.50/GB | Yes | AGPL-3.0 |
| VictoriaLogs | Self-hosted only | Unlimited | $0 license | Yes | Apache 2.0 |
How to Choose Without Migrating Twice
- Price your own workload, not a vendor's example. Run last month's real host count, ingest volume and seat count through the script above. The ranking changes with a workload's shape, not just its size.
- Split the bill by line item first. If per-host APM is 60 percent of your invoice, cheaper log storage saves almost nothing. Datadog itemizes infrastructure, APM, logs and custom metrics, so the answer is on your bill.
- Send OpenTelemetry to two backends at once. The OTLP exporter takes multiple endpoints, so run the candidate alongside Datadog for a billing cycle and compare invoices.
- Check retention defaults against your incident review window. Several platforms default to 15 or 30 days; if postmortems reach back a quarter, extended retention is a line item to add before comparing.
- Read the license, then count the operational hours. AGPL-3.0, MIT-with-carve-out and Apache 2.0 are materially different commitments, and a self-hosted tier saving $1,700 a month is only a win if it costs under an engineer-week to run.
Which One Should You Actually Use?
Already on Grafana dashboards: Grafana Cloud. The migration is a data source change, not a retraining exercise, and the 50 GB free logs tier covers a small production footprint.
Paying mostly for hosts, not data: New Relic. Swapping per-host APM for per-GB ingest is where the 40 percent saving above comes from, provided full platform seats stay under five.
A small team also paying for uptime and on-call: Better Stack. Collapsing three vendors into a $30 bundle beats a lower per-GB rate you then supplement with PagerDuty and a status page.
Out of per-seat and per-host billing entirely: SigNoz. The most complete open source replacement, MIT at the core, with the lowest real entry point of any full platform here.
Already running object storage: VictoriaLogs for logs alone, or OpenObserve for logs, metrics, traces and RUM in one binary. Apache 2.0 versus AGPL-3.0 decides it, not the feature list.
Conclusion
What changed in 2026 is not that alternatives got cheaper. It is that OpenTelemetry became the default emit path for 76 percent of surveyed teams, turning the backend into a configuration line rather than a rewrite. The measurement above puts the realistic saving at 37 to 65 percent on an identical workload, not the order of magnitude the marketing claims.
Before renewing, ask which line item is actually growing. If it is hosts, you need a different billing model. If it is indexed log events, you need different retention rules, and possibly not a new vendor at all.
Related DevToolLab Tools
- Grok Pattern Tester - debug the
%{SYNTAX:SEMANTIC}patterns that turn raw log lines into structured fields before you ship a pipeline to a new backend. - Syslog Parser - decode RFC 5424 and RFC 3164 messages to check what a collector is really forwarding mid-migration.
- Nginx Log Analyzer - see which routes generate the access-log volume you pay per GB for.
- JSONL Viewer - inspect newline-delimited exports from these platforms without opening a multi-gigabyte file.
Related Guides
- Best Sentry Alternatives in 2026 covers error tracking, which most platforms above handle less well.
- Best eBPF Observability Tools in 2026 covers the zero-code agents feeding these backends.
- OpenTelemetry Node.js Setup Guide walks the pipeline that makes swapping backends a config change.
- Best LLM Observability Tools compares tracing built for prompt and token workloads.